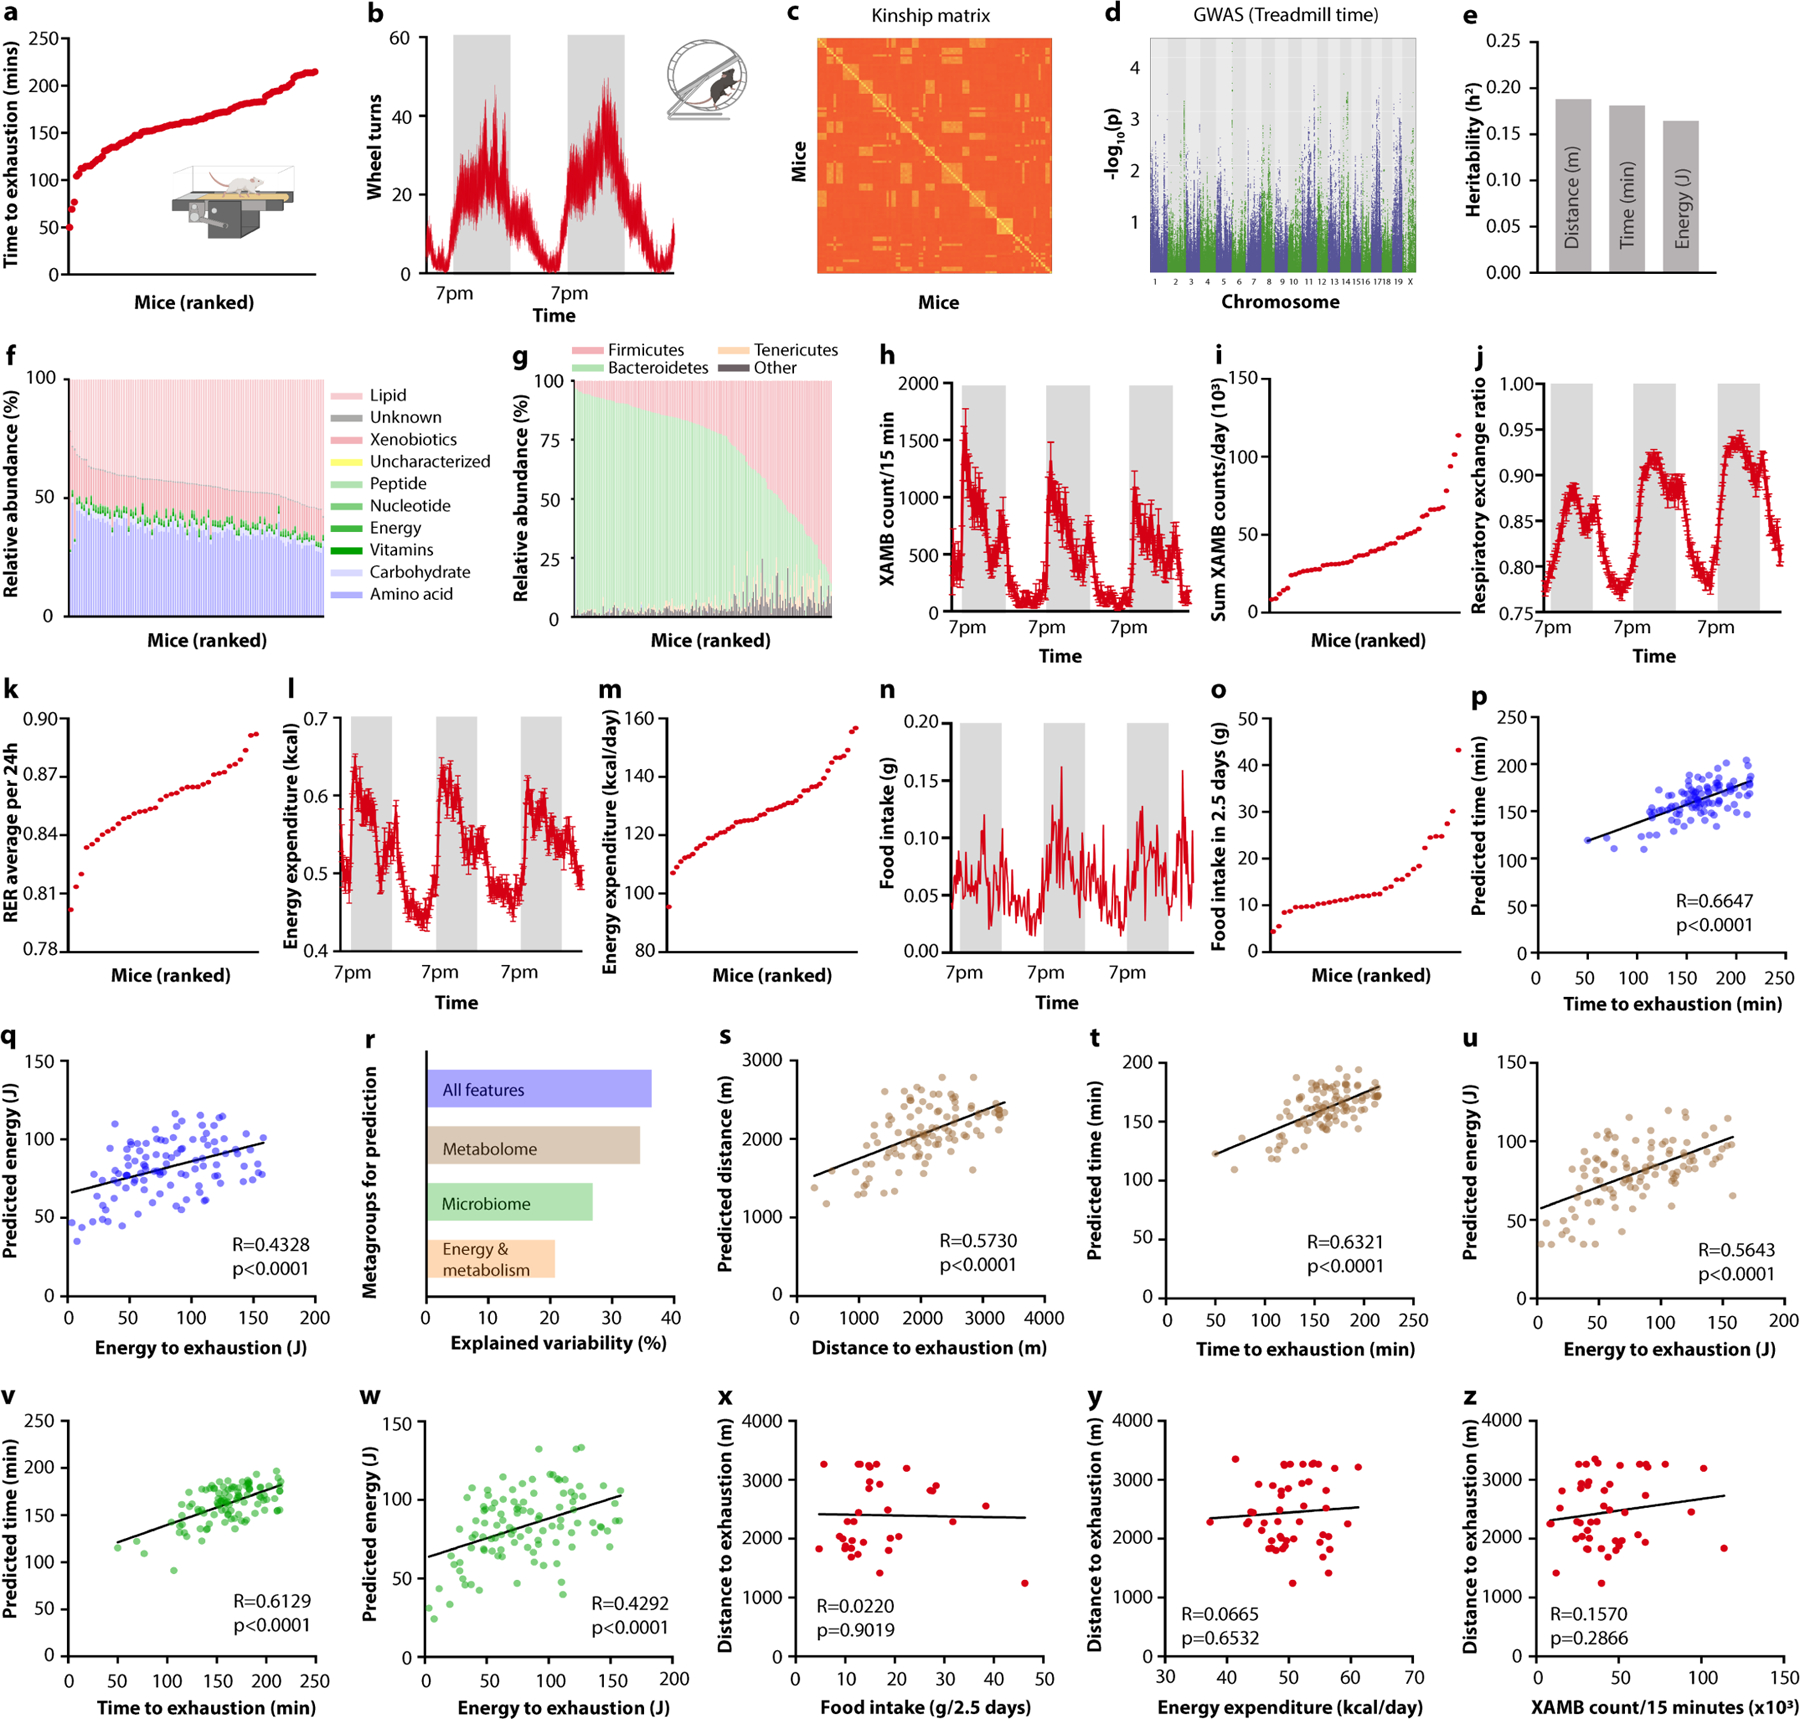
Extended Data Fig. 1 |. Prediction of exercise performance in diversity-outbred mice.

a, Ranking of diversity-outbred (DO) mice by time spent on treadmill until exhaustion. b, Wheel turn recording of DO mice over two consecutive days. c, Kinship matrix of DO mice. d, GWAS for time spent on treadmill during endurance exercise of DO mice. d, (D) Heritability (h2) calculated for distance, time, and energy spent on treadmills. f, Classification of serum metabolomes of DO mice. g, Taxonomies based on 16S rDNA sequencing of DO mice. h-o, Recording traces (h, j, l, n) and quantification (i, k, m, o) of horizontal movement (h, i), respiratory exchange ratio ( j, k), energy expenditure (l, m), and food intake (n, o) of DO mice. p, q, Algorithm-predicted versus measured treadmill time (p) and energy (q) based on a model including all assessed non-genetic features. r, Explained variability for “metagroups” of non-genetic variables used for prediction. s-w, Algorithm-predicted versus measured treadmill distance (s), time (t, v), and energy (u, w) based on a model including the serum metabolome (s-u), and microbiota features (v, w). x-z, Correlation of food intake (x), energy expenditure (y), and spontaneous locomotion (z) with treadmill distance. Error bars indicate means ± SEM. Exact n and p-values are presented in Supplementary Table 2.
