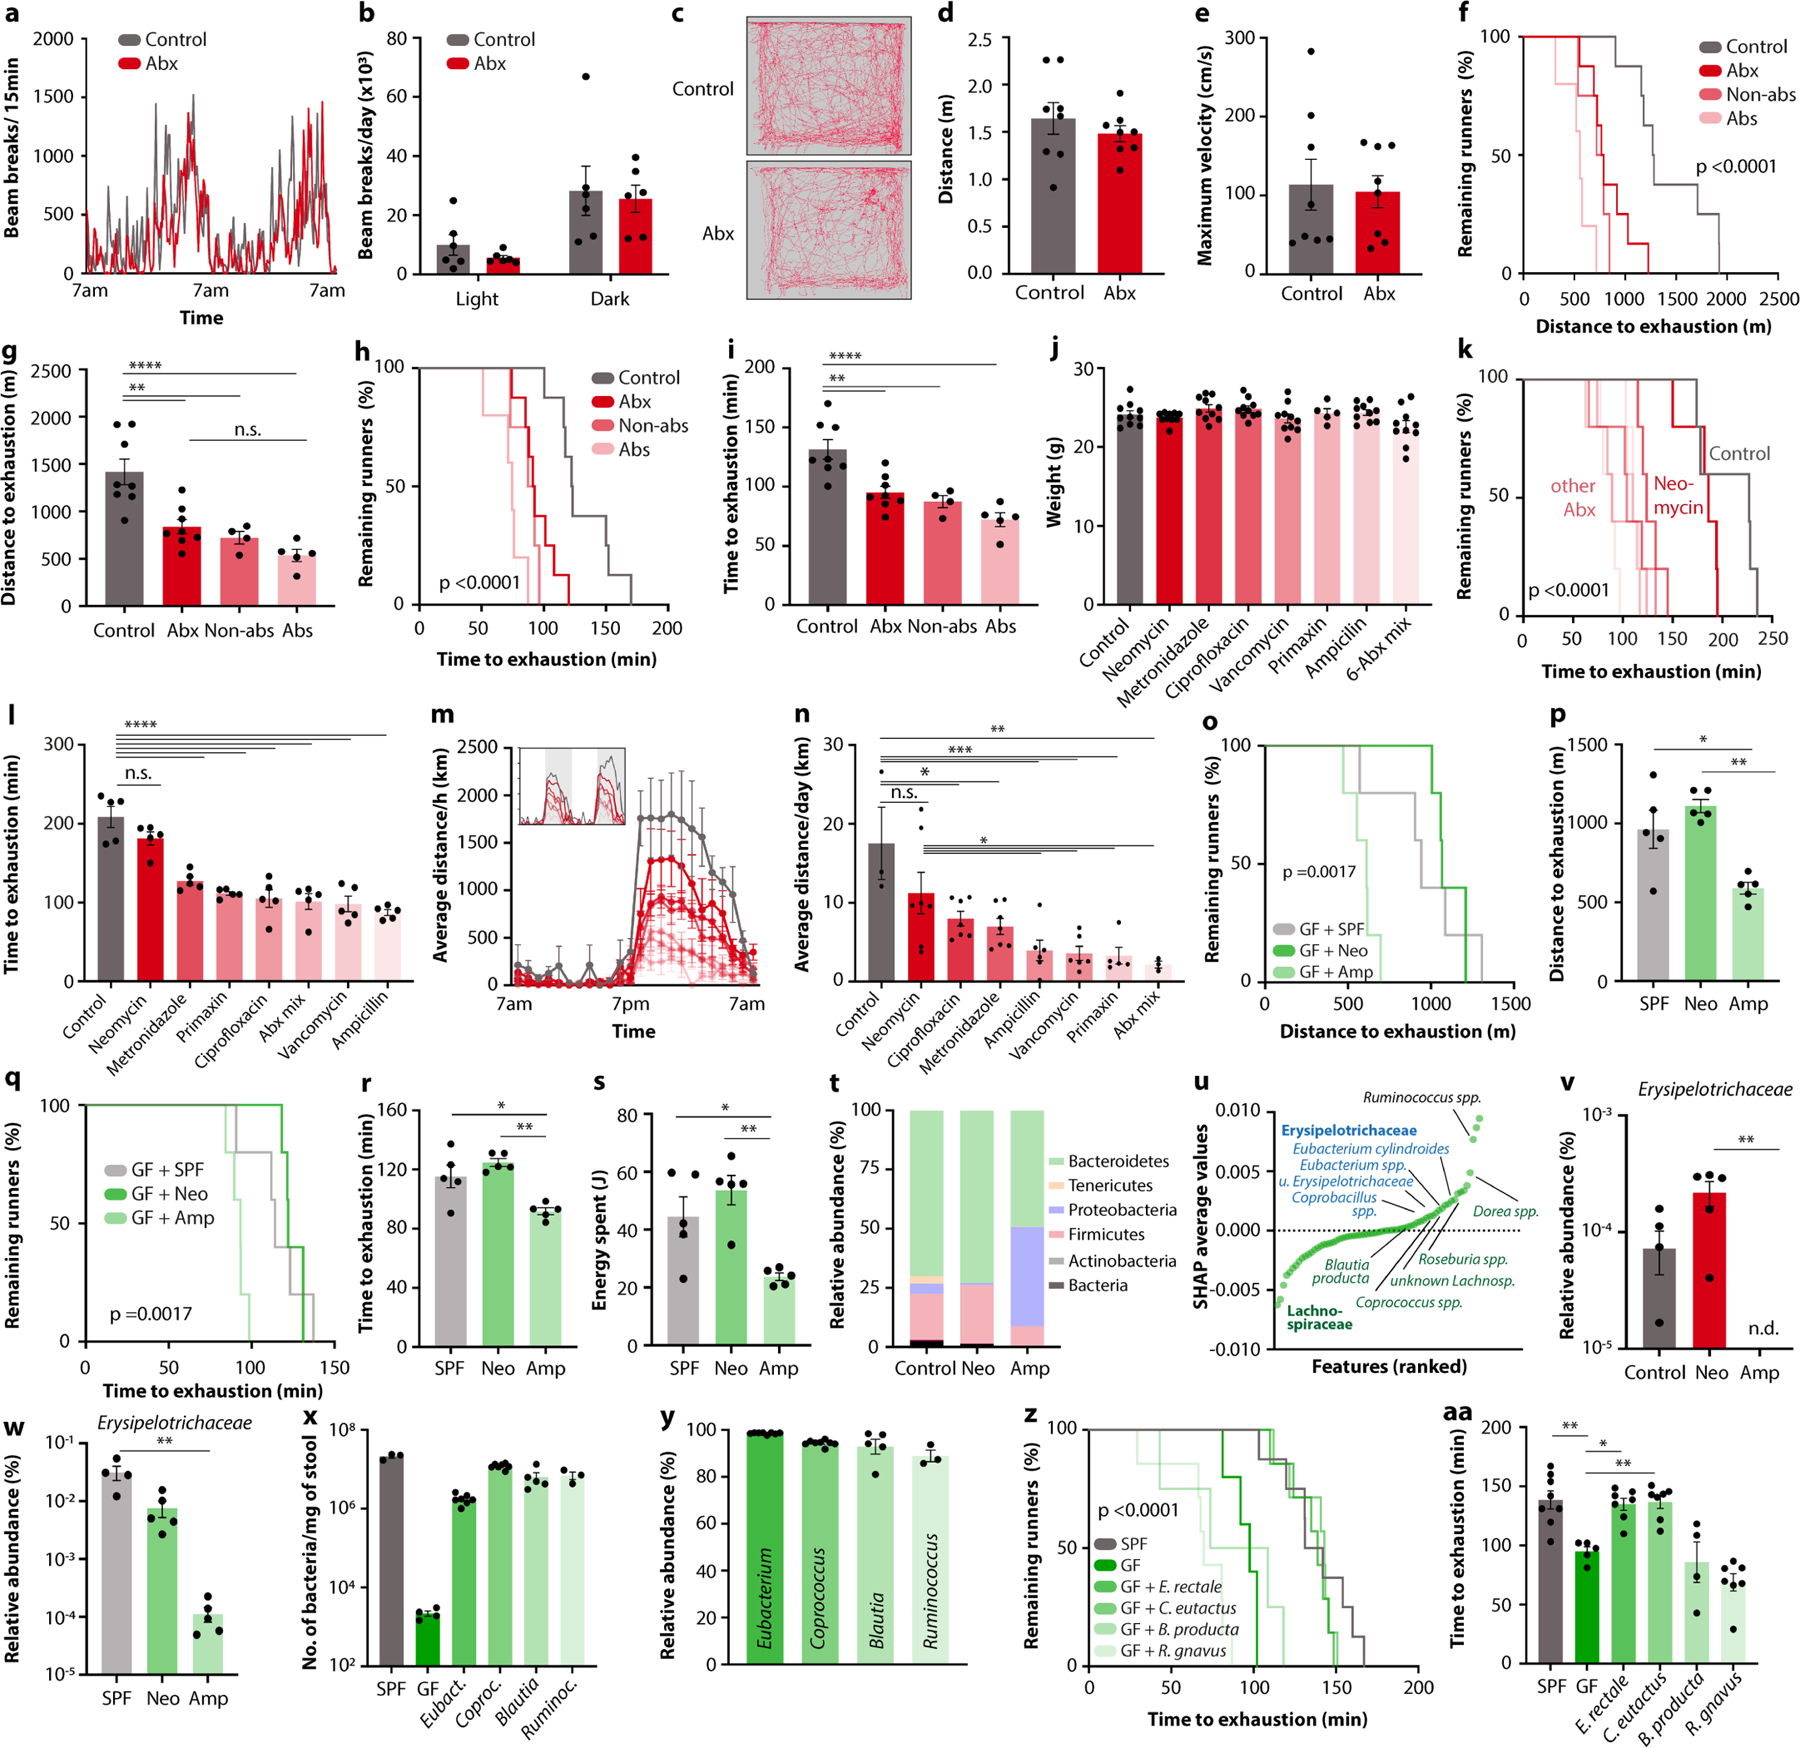
Extended Data Fig. 3 |. Taxonomic analysis of microbiome features associated with exercise performance.

a, b, Recording (a) and quantification (b) of free horizontal movement measured in metabolic cages for two consecutive days in Abx-treated mice and controls. c-e, Open field locomotion (c), distance quantification (d) and velocity quantification (e) of Abx-treated mice and controls. f-i, Kaplan-Meier plots (f, h) and quantifications (g, i) of distance (f, g) and time (h, i) on treadmill of mice treated with either absorbable (Abs) or non-absorbable (Non-abs) antibiotics, or a broad-spectrum mixture (Abx). j-n, Body weight ( j), Kaplan-Meier plot (k) and quantification (l) of time on treadmill, averaged hourly distance (m) and quantification (n) of voluntary wheel activity of mice treated with the indicated antibiotics. Inset shows representative recording traces. o-s, Kaplan-Meier plots (o, q), and quantifications (p, r, s) of treadmill distance (o, p), time (q, r) and energy (s) of GF mice colonized with microbiome samples from conventional (SPF), neomycin-treated (Neo) or ampicillin-treated (Amp) mice. t, Phylum-level taxonomic microbiome composition of neomycin- and ampicillin-treated mice. u, SHAP-value ranking of all microbiota features contributing to prediction of exercise performance in DO mice. v, w, Relative abundance of Erysipelotrichaceae in neomycin- and ampicillin-treated mice (v) and GF mice receiving their microbiome samples (w). x-aa, Bacterial load (x), taxonomic composition (y), treadmill distance, Kaplan-Meier plot (z) and quantification (aa) of SPF mice, GF mice, and GF mice mono-colonized with the indicated bacterial species. Error bars indicate means ± SEM. * n.s. not significant, * p < 0.05, ** p < 0.01, *** p<0.001, **** p < 0.0001. Exact n and p-values are presented in Supplementary Table 2.
