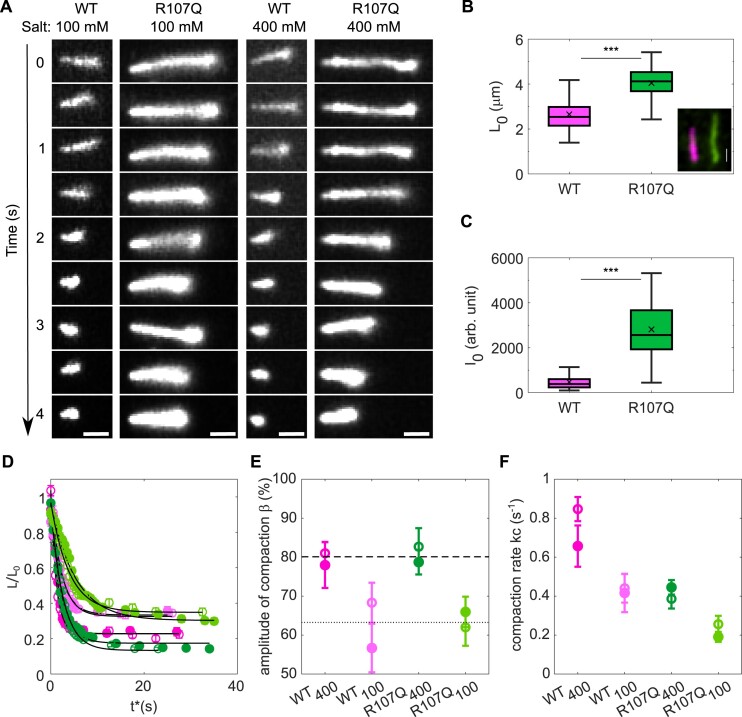
Figure 2.
mtSSBR107Q has reduced ssDNA compaction activity. (A) Selected frames from movies recording ssDNA compaction by mtSSBWT-Alexa555 or mtSSBR107Q-Alexa555 at two different salt concentrations (100 and 400 mM NaOAc) (scale bar, 1 μm). (B) Initial ssDNA length measurement at t0 before adding salt. Median values of L0 are 2.56 μm (n = 131) and 4.14 μm (n = 147) for WT and R107Q, respectively. Example image of a two-color experiment (inset) showing one ssDNA covered by mtSSBWT-Alexa647 (magenta) and one ssDNA molecule covered by mtSSBR107Q-Alexa555 (green) (scale bar, 1 μm). (C) Initial intensity of mtSSB-coated ssDNA at t0 before adding salt. Median values for WT and R107Q are 411 a.u. (n = 59) and 2745 a.u. (n = 59), respectively. In (B, C), boxplots represent the median within the IQR and P-values were calculated using unpaired Student's t-tests, ***P < 0.001. (D) For each condition, ssDNA length normalized by L0 averaged over 40 to 90 ssDNA molecules measured in three different experiments as a function of time showing an exponential decay (dark green: WT at 400 mM salt, light green: WT at 100 mM salt, dark pink: R107Q at 400 mM salt, light pink: R107Q at 100 mM salt). Open and closed symbols of the same color represent two different replicates. Error bars are the standard deviation. (E) Amplitude of compaction (β) in percentage of initial length for WT and R107Q at 100 and 400 mM salt. (F) Compaction rate (kc) for WT and R107Q at 100 and 400 mM salt. For (E) and (F), amplitude and compaction rates are obtained from an exponential fit to the data (black curves in (D)), and error bars indicate a 95% confidence level.

