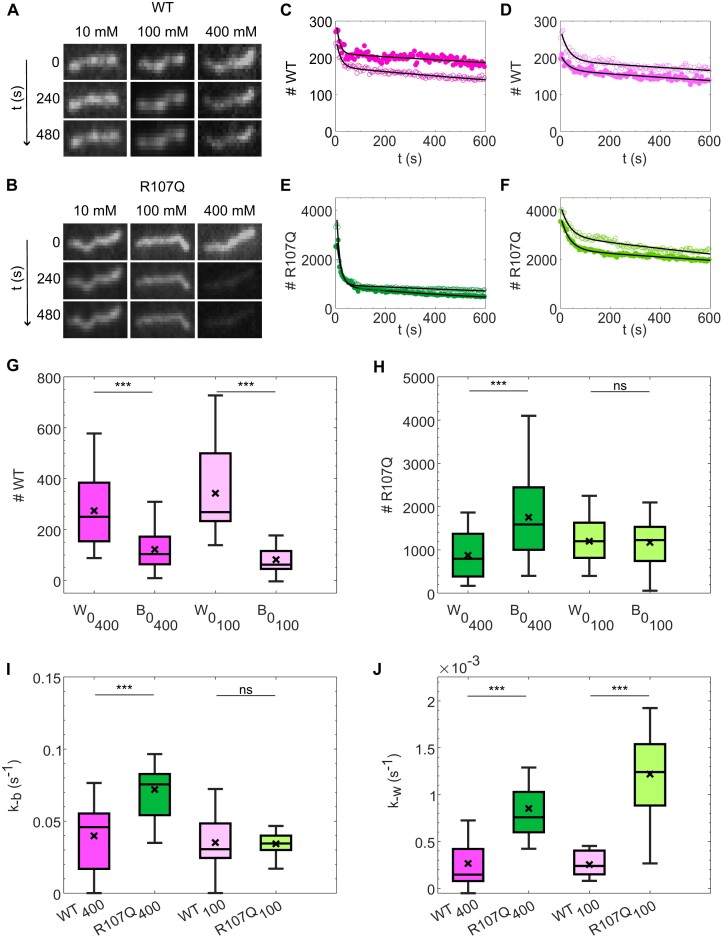
Figure 4.
Disassembly of mtSSB from ssDNA is faster for mtSSBR107Q than for mtSSBWT. Typical fluorescence images of stretched mtSSBWT (A) or mtSSBR107Q (B) -ssDNA complexes at different NaOAc concentrations (10, 100 and 400 mM) at indicated time intervals. Images were acquired with an exposure time of 0.1 s every 5 s to limit the effects of photobleaching. Fluorescence intensity was converted into number of mtSSB monomers as described in Supplementary Figures S7 and S8 and the number of mtSSB monomers bound was followed over time at different salt concentrations (C–F). Example traces for mtSSBWT at 400 mM NaOAc (C), mtSSBWT at 100 mM NaOAc (D), mtSSBR107Q at 400 mM NaOAc (E), mtSSBR107Q at 100 mM NaOAc (F). Open and closed symbols of the same color represent two different replicates, black curve: fit to the data. All traces are shown in Supplementary Figure S9. Initial number of molecules in the wrapped state w0 and in the bound state b0, in experiments where 100 or 400 mM NaOAc was subsequently added, for mtSSBWT (G) and mtSSBR107Q (H). Unbinding rate k-b (I) and unwrapping rate k-w (J). (G–J) The box plots represent the median with the IQR of the parameters obtained by fitting 30–60 ssDNA molecules acquired in three different experiments for each condition. Both mtSSBR107Q and mtSSBWT were labelled with Alexa 555.

