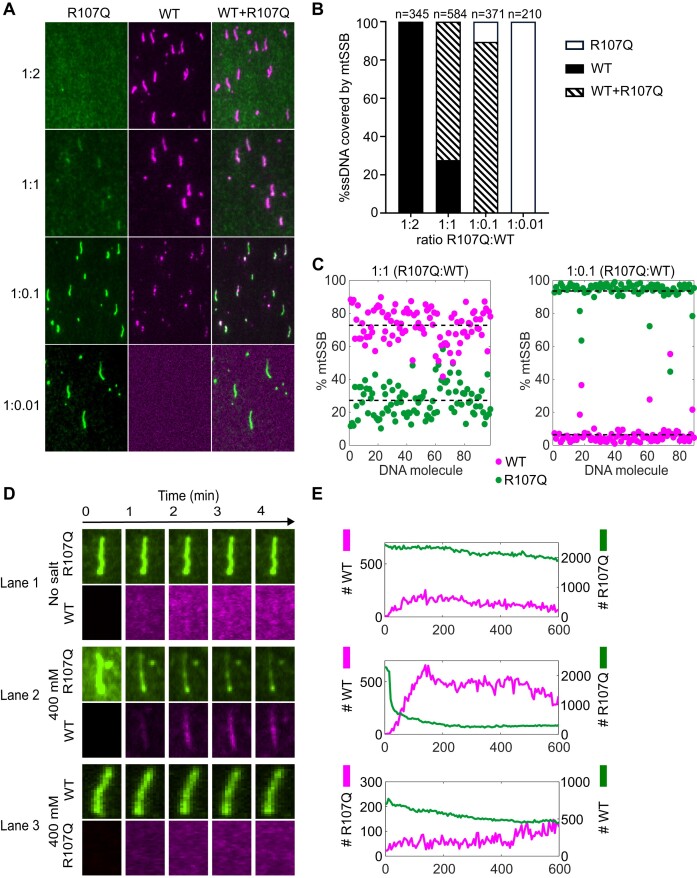
Figure 5.
Binding competition between mtSSBWT and mtSSBR107Q. (A–C) Binding competition at different mtSSBR107Q-Alexa555(green):mtSSBWT-Alexa647(magenta) protein concentration ratios. (A) Representative images of nucleoprotein complexes at different concentration ratios: 1:2, 1:1, 1:0.1, 1:0.01 (R107Q:WT). The mix of the two proteins was incubated with ssDNA for 60 min and the nucleoprotein complexes formed were attached on the glass surface. Image contrasts were adjusted differently for each ratio to visualize low abundance proteins. (B) Histogram showing in percentage the number of ssDNA molecules covered by only mtSSBWT, both mtSSBWT and mtSSBR107Q or only mtSSBR107Q in each condition. (C) Quantification of mtSSB molecules on ssDNA molecules coated by both mtSSBWT and mtSSBR107Q, at 1:1 (left) and 1:0.1 (right) ratios. (D, E) Real-time competition between mtSSBR107Q and mtSSBWT. (D) TIRF images of nucleoprotein complexes over time in three different settings. The upper line of each configuration (1–3) shows mtSSBR107Q-Alexa555 or mtSSBWT-Alexa555–ssDNA complexes stretched at the surface of the flow-cell. The lower line shows mtSSBR107Q-Alexa647 or mtSSBWT-Alexa647 that is added to the flow-cell in the presence of salt. (E) Intensity measurement of mean intensities of ssDNA–mtSSB complexes as a function of time for each configuration (1–3).

