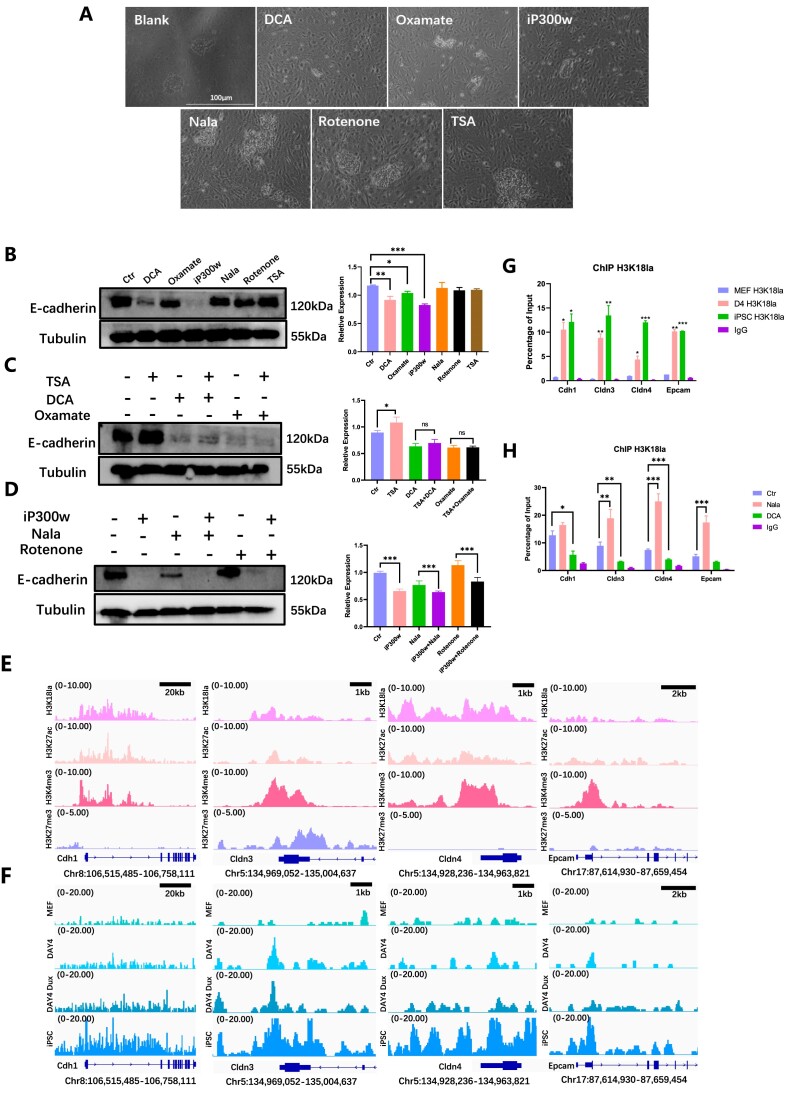
Figure 3.
H3K18la promotes mesenchymal-epithelial transition. (A) The cellular morphology was observed under light microscopy following treatment with H3K18la regulators during the early stages of reprogramming. (B) WB showed E-cadherin level treated with H3K18la regulators in early reprogramming. The statistical graph showed E-cadherin relative expression. Bars represent the mean and SD of n = 4 independent experiments. (C) WB showed E-cadherin level when treated with TSA combined with DCA or sodium oxamate in the early reprogramming. The histogram analysis indicated the relative statistical values of E-cadherin for each group. Bars represent the mean and SD of n = 4 independent experiments. (D) WB showed E-cadherin level when treated with iP300w combined with Nala or Rotenone in the early reprogramming. The histogram analysis showed the relative statistical values of E-cadherin for each group. Bars represent the mean and SD of n = 4 independent experiments. (E) Public bioinformatic analysis showed the enrichment of H3K18la, H3K27ac, H3K4me3, and H3K27me3 epithelial-related genes. (F) CUT&Tag analysis showed the enrichment of H3K18la on epithelial-related genes in MEF, D4, Dux D4 and iPSC. (G) ChIP-qPCR showed H3K18la enrichment on epithelial-related genes during reprogramming. Bars represent the mean and SD of n = 3 independent experiments. (H) ChIP-qPCR showed H3K18la enrichment on epithelial-related genes in reprogramming Day 4 with H3K18la regulators. Bars represent the mean and SD of n = 3 independent experiments. *P< 0.05, **P< 0.01, ***P< 0.001. t-test.

