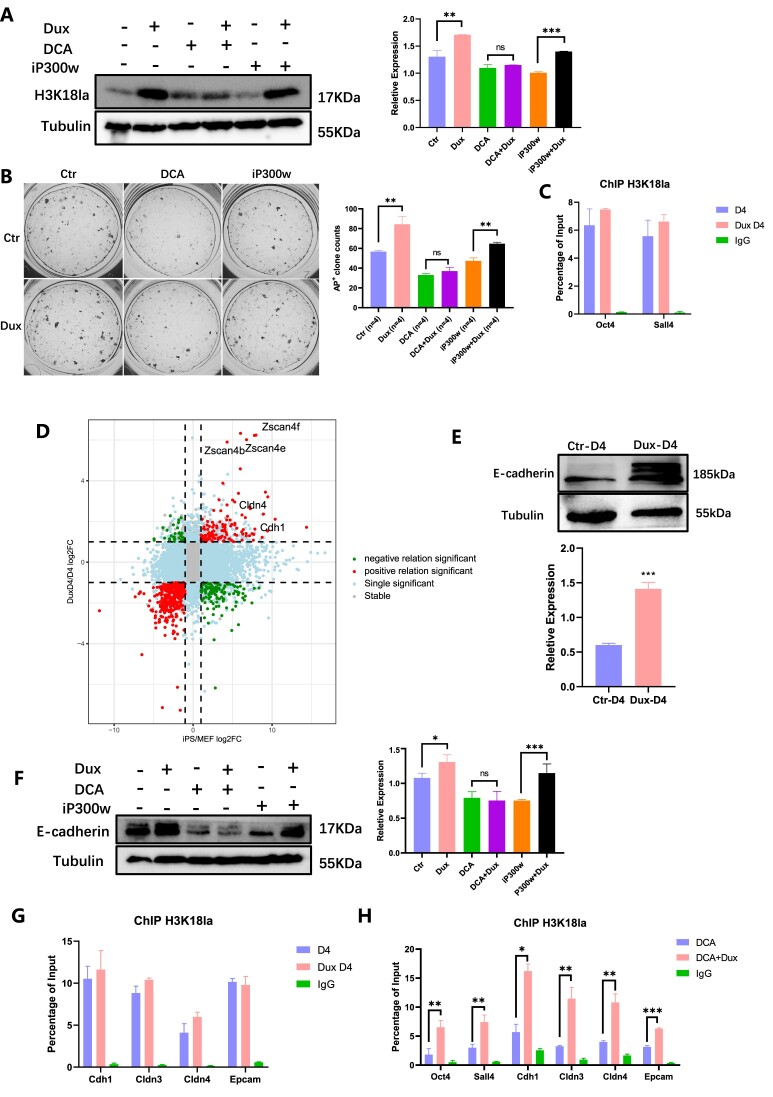
Figure 4.
Dux facilitates H3K18la dynamic changes during reprogramming. (A) WB showed the level of H3K18la in combination with Dux OE and DCA or iP300w. The histogram analysis displayed the relative statistical values of H3K18la for each group. Bars represent the mean and SD of n = 4 independent experiments. (B) AKP staining showed clones treated with Dux OE, DCA, and iP300w. The histogram analysis of the AP + clones in each group. Bars represent the mean and SD of n = 4 independent experiments. (C) ChIP-qPCR of H3K18la enrichment on pluripotent-related genes on Dux D4. Bars represent the mean and SD of n = 3 independent experiments. (D) Nine-quadrant scatter plot showed the relationship between differential expression genes (DEGs) in Dux D4 compared to D4 (Log2FoldChange > 1 & Padj < 0.05), and the DEGs in iPSC compared to MEF. (E) WB showed the level of E-cadherin with Dux OE. The histogram analysis indicated the relative statistical values of E-cadherin for each group. Bars represent the mean and SD of n = 3 independent experiments. (F) WB showed the level of E-cadherin in combination with Dux OE and DCA or iP300w. The histogram analysis displayed the relative statistical values of E-cadherin for each group. Bars represent the mean and SD of n = 4 independent experiments. (G) ChIP-qPCR showed H3K18la enrichment on epithelial-related genes with Dux OE. Bars represent the mean and SD of n = 3 independent experiments. (H) ChIP-qPCR showed H3K18la enrichment on epithelial-related genes and pluripotent-related genes with H3K18la regulated. Bars represent the mean and SD of n = 3 independent experiments. *P< 0.05, **P< 0.01, ***P< 0.001. t-test.

