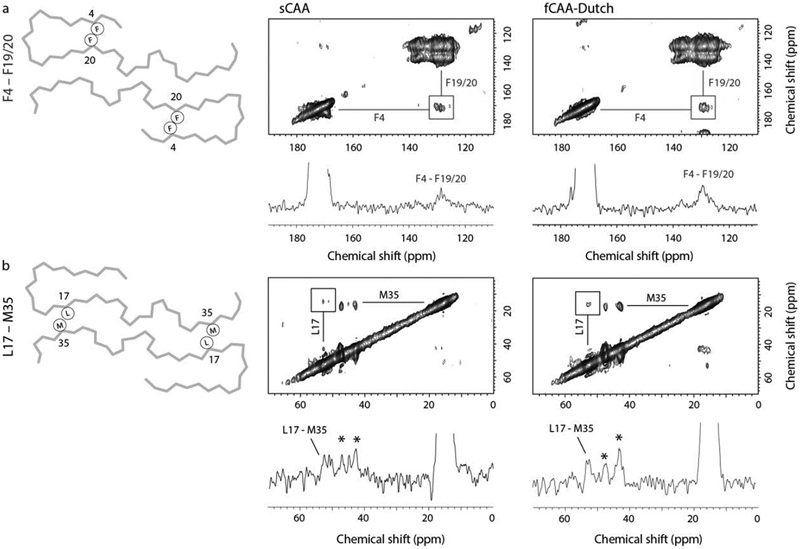
Fig. 3.
Probing brain-derived Aβ40 fibrils for population A with solid-state NMR. Two-dimensional 13C DARR NMR measurements of fibrils derived from sCAA and fCAA-Dutch patients. The fibrils were produced via templated growth of brain amyloid using specifically 13C-labeled Aβ40 to probe inter-residue contacts modeled in the cryo-EM structures. (a) F4-F20 interaction. A scheme of the backbone trace of population A (left) highlighting the close intramolecular contact of F4 and F20. Region of the 2D DARR NMR spectrum (right) exhibiting cross peaks between 1-13C F4 and ring-13C-F20 (or F19). The 1D row extracted from the 2D spectrum passes through the diagonal resonance of 1-13C F4 and highlights the cross peak between 1-13C F4 and ring-13C-F20 (or F19). The 13C labeling scheme chosen for these measurements generally provides well-resolved resonances such that cross-peaks can be assigned to specific residue contacts. One exception is that the F19 and F20 13C labels overlap but are predicted to interact with either G33 or F4, respectively. The presence of the F4-F19/20 cross peak (square) is consistent with the close distance between F4 and F20 in the cryo-EM structure in both the sCAA and fCAA-Dutch patient samples. We also observe a cross peak between F19 and G33 (not shown), which is consistent with the population A structure. Note that the cross peak intensities in DARR NMR spectra are often not symmetric (see Ohashi and Takegoshi (2006)). (b) L17-M35 interaction. A scheme of the backbone trace of population A (left) highlights the close intermolecular contact of L17 and M35, while the 2D DARR NMR spectrum (right) exhibits cross peaks between 2-13C L17 and 5-13C M35. The 1D row extracted from the 2D spectrum passes through the diagonal resonance of 5-13C M35 and highlights the cross peak between 5-13C M35 and 2-13C L17. Cross peaks (asterisks) are also observed between 5-13C M35 and 2-13C G33, residues that are close together in the Aβ sequence. However, on the basis of the two structures presented here, these cross peaks may arise from the β-hairpins populating the outer densities in population B (see below). The population A structure indicates a register shift with respect to a previously published similar structure, leading to a flip of the C-terminal segment. This shift results in a close proximity between L17 and M35 consistent with the presence of observed cross-peaks in the DARR NMR spectra of the sCAA and fCAA-Dutch patient fibrils.

