Fig. 5.
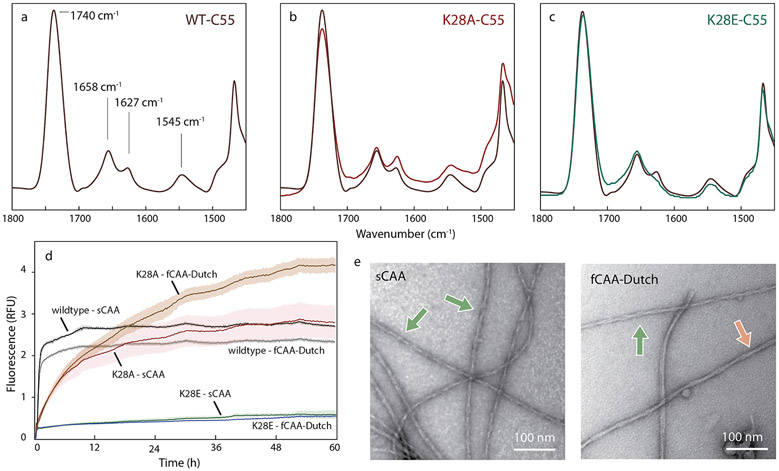
An electrostatic cluster mediates central interactions for both structures. Probing the D1-E22-D23-K28 cluster in C55 and brain-derived Aβ40 fibrils, (a–c) FTIR spectra of (a) wild-type C55, (b) K28A C55 and (c) K28E C55 reconstituted into DMPC:DMPG bilayers. The acyl chain C=0 vibration of the lipids is observed at ~ 1740 cm−1. The amide I region is between 1600 and 1700 cm−1 and the amide II region is between 1500–1560 cm−1. The band at ~1658 cm−, corresponds to the ™ α-helix, and the band at ~1627–1630 cm−1 corresponds to the N-terminal β-sheet. The K28A mutation increases the ~1630 cm−1 band relative to the 1658 cm−1 band, while the K28E mutation results in a decrease. (d) Templated growth upon G3 brain-derived fibrils was assessed by thioflavin T fluorescence using wild-type Aβ40, and the K28A and K28E mutants. For comparison, positive controls are shown (black and grey traces). The study was performed in triplicate and the results averaged, with noise representing standard deviation. The Aβ40 monomer containing the K28A mutation resulted in template growth for both brain-derived samples, but the initial fluorescence increase is slower than the positive control. The Aβ40 monomer containing the K28E mutation was not able to add to the brain-derived fibrils. (e) Representative negative stain TEM micrographs for the K28A Aβ40 mutant that successfully templated, as shown in (d), upon the sCAA (top) and fCAA-Dutch (bottom) patient samples. We observe fibrils in all cases, with helical characteristics similar to population A (green arrow) or population B (red arrow).

