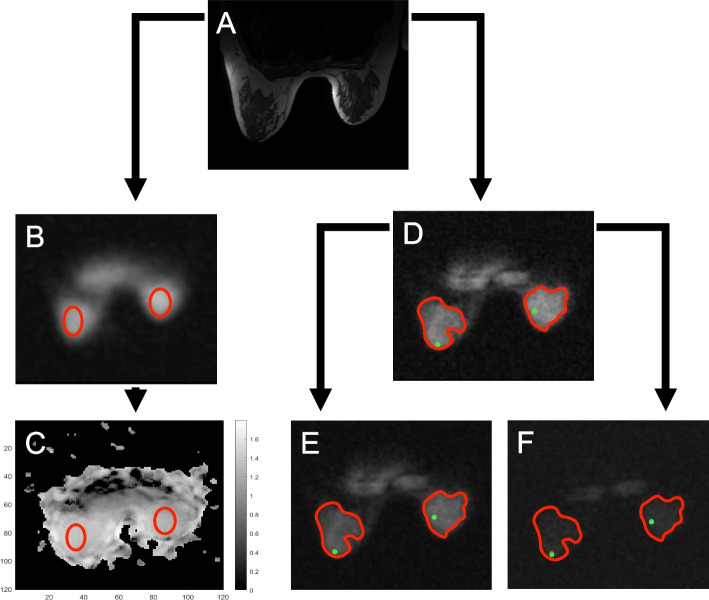
Fig. 1.
The measurement of total and fluid-attenuated sodium concentration in fibroglandular tissue (FGT). FGT at the nipple level was first identified on T1- and T2-weighted images (T2-weighted image shown in a). The readers placed as large ellipsoid region of interest (ROIs) (red) encompassing only FGT (b) as possible on the low-resolution 80° B1 image; ROIs were then propagated on the B1 image (c). The readers delineated the confidently visualisable FGT (SROI, red) and placed a circular small region of interest on the FGT with the highest signal intensity (SROI, green) (d). These ROIs were then propagated in the scaled high-resolution (e) and inversion recovery (f) images. The boundaries of the ROIs were thickened for illustrative purposes

