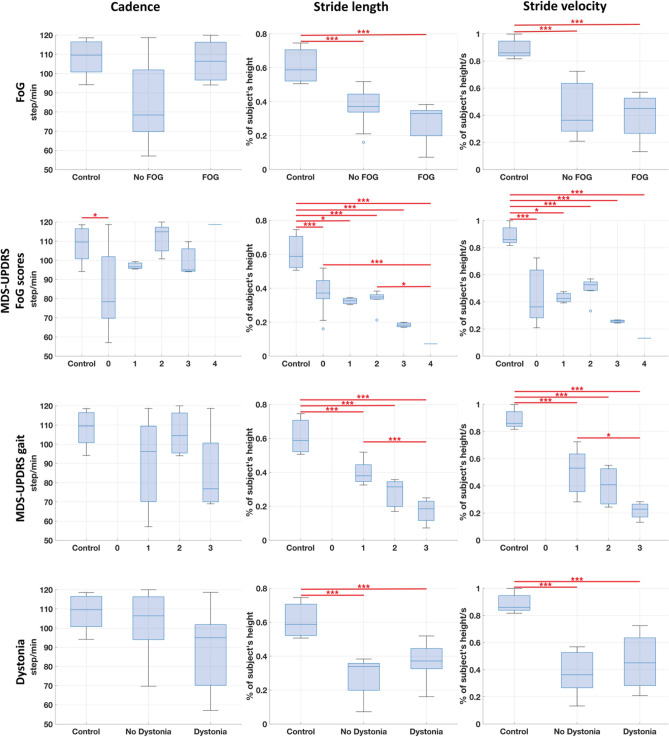
Figure 4.
Cadence, stride length, and stride velocity boxplots for different clinical characteristics. Boxplots of cadence, stride length, and stride velocity for presence/absence of freezing of gait (FoG) on clinical examination, MDS-UPDRS FoG scores (Item 3.11), MDS-UPDRS gait scores (Item 3.10), and presence/absence of dystonia on clinical gait examination. The boxplots visually summarize the distribution of data. Each boxplot displays the median (central line), interquartile range (box edges), and overall range excluding outliers (whiskers). Outliers are marked with individual points. Pairwise significant differences were assessed with a mixed regression model and are indicated by a horizontal red line. *** indicates p-value < 0.001, while * indicates p-value < 0.01.

