. 2023 Dec 14;5(6):e230155. doi: 10.1148/ryct.230155

Figure 5:

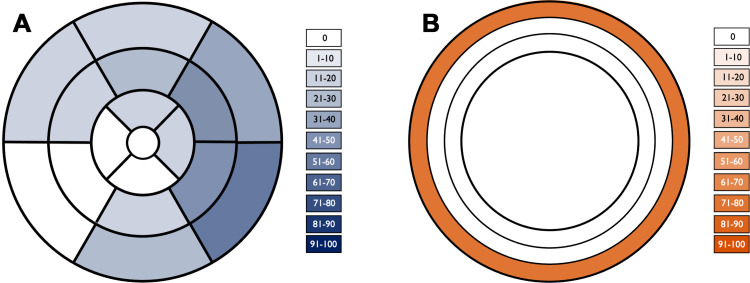
Segmental distribution of late gadolinium enhancement. (A) Color-shaded polar plot represents the percentage of patients with late gadolinium enhancement for each myocardial segment according to a standardized 17-segment model. (B) Color-shaded plot of the ventricular myocardium represents the percentage of patients with late gadolinium enhancement in each myocardial layer (from outer to inner: subepicardial, midwall, and subendocardial).

Segmental distribution of late gadolinium enhancement. (A) Color-shaded polar plot represents the percentage of patients with late gadolinium enhancement for each myocardial segment according to a standardized 17-segment model. (B) Color-shaded plot of the ventricular myocardium represents the percentage of patients with late gadolinium enhancement in each myocardial layer (from outer to inner: subepicardial, midwall, and subendocardial).