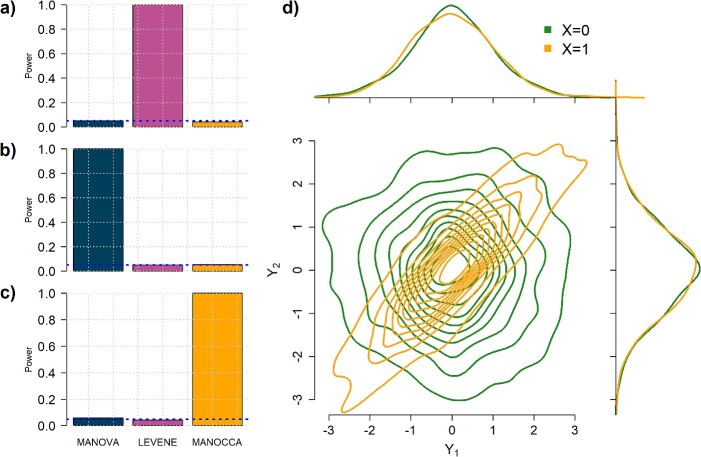
Figure 3.
Orthogonality between MANOCCA and other tests. We simulated a series of datasets under three models where a binary predictor  influences orthogonally either the mean, the variance or the covariance of a bivariate outcome
  . In model (A), each outcome
  is drawn from a standard additive model:
  , where
  is a normally distributed variable shared across
  and
and  are independent normal residuals. In model (B), each
  is drawn from
  , where
  is normally distributed variables producing heterogeneity in the variance of
  conditional on
  . In model (C), each
  is drawn from the interaction model
  , which produces heterogeneity in the correlation across
  conditional on
  . For each model, we derived the power at the P-value threshold of 0.05 for a joint mean effect test (MANOVA), a test of variance for a randomly selected
  (LEVENE) and the proposed covariance test (MANOCCA). The parameters
  ,
,  and
and  were chosen to maximize the power of the at least one of the three tests. The dashed line indicates the P-value threshold of 0.05. (D) shows an example of a bivariate distribution where
  is not associated with the mean and variance of the two outcomes but with their covariance.

