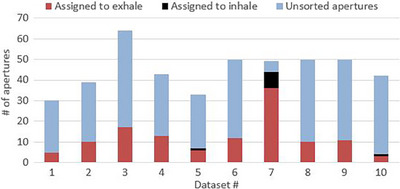
FIGURE 5.

A plot of the number of sorted apertures. The number of sorted apertures and the number of unsorted apertures for each clinical dataset after the “Aperture Sorting” method was used. It was unsuccessful at bringing Dmax below the assigned dose limit for dataset #7 and attempted to sort every aperture; the five unsorted apertures contributed equally to both breathing phases.
