FIGURE 2.

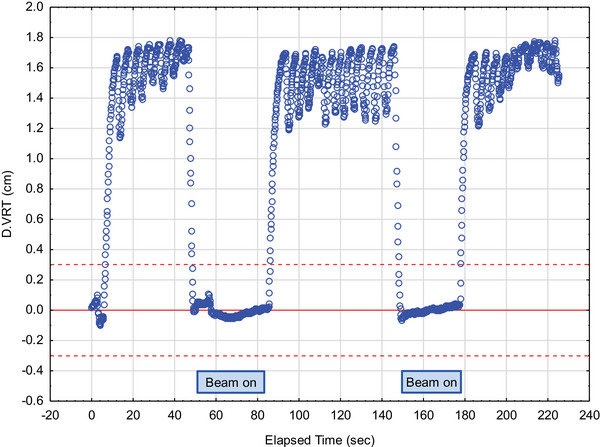
Time plot showing the vertical breathing curve amplitude over time. The dashed red lines represent the lower and upper limit of the gating window, and the solid red line the reference position.

Time plot showing the vertical breathing curve amplitude over time. The dashed red lines represent the lower and upper limit of the gating window, and the solid red line the reference position.