FIGURE 3.

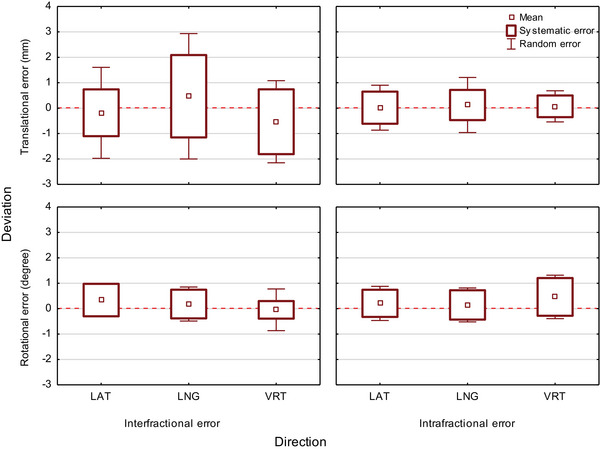
Box plot showing the inter‐ and intrafractional translational and rotational mean setup error, systematic error, and random error in the lateral, longitudinal, and vertical directions.

Box plot showing the inter‐ and intrafractional translational and rotational mean setup error, systematic error, and random error in the lateral, longitudinal, and vertical directions.