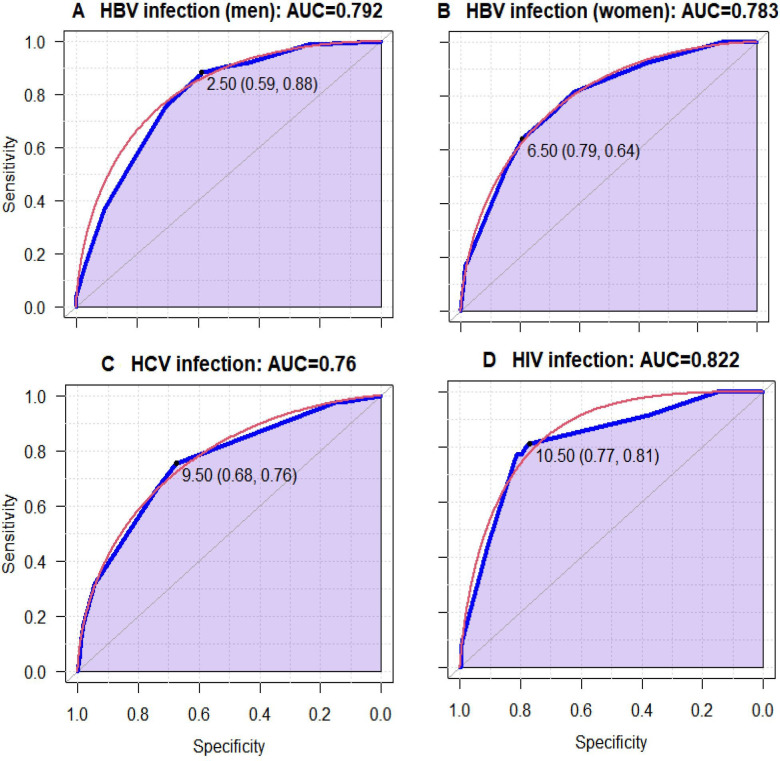
Figure 1.
Mean receiver operating characteristics (ROC) curve for multivariable logistic regression models. Each blue line indicates the ROC curve. (A) The area under the curve (AUC) for the HBV infection in men, the AUC for this model is 0.792, indicating a good fit. The threshold was 2.50, specificity=0.88 and sensitivity=0.59. (B) The AUC for HBV in women, which was 0.783. The threshold was 6.50, specificity=0.79 and sensitivity=0.64. (C) The curve for HCV has an AUC of 0.760, indicating a fair fit for the score. The threshold was 9.50, specificity=0.76 and sensitivity=0.68. (D) The AUC for the HIV infection. The AUC for this model is 0.822, indicating a good fit. The threshold was 10.50, specificity=0.81 and sensitivity=0.77. HBV, hepatitis B virus; HCV, hepatitis C virus.

