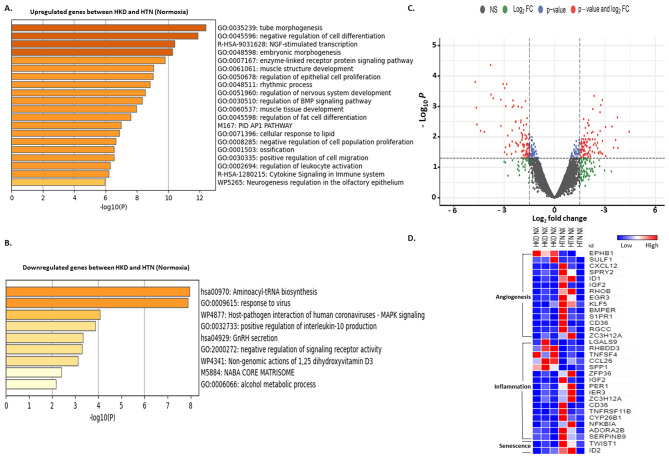
Fig. 6.
Normoxia HKD vs. normoxia HTN MSCs. Gene ontology (GO) analysis of hallmark and biological process of upregulated (A) and downregulated (B) gene sets respectively with significant changes between normoxia HKD and normoxia HTN MSCs. Volcano plot of dysregulated genes between normoxia HKD and normoxia HTN MSCs (C). The vertical axis (y-axis) corresponds to the -log (p-value) and the horizontal axis (x-axis) displays the log-fold change value. Genes with higher and lower levels between normoxia HKD and normoxia HTN MSCs are shown with red and blue dots, respectively, while non-significant genes are shown as grey dots. Specifically, red dots represent significance with the p-value and log2 FC, blue dots represent significance with p-values only, and the green dots represent significance with the log2 FC values. Heat map of genes with significant changes in normoxia HKD vs. normoxia HTN MSCs for angiogenesis, inflammation, and senescence (D)

