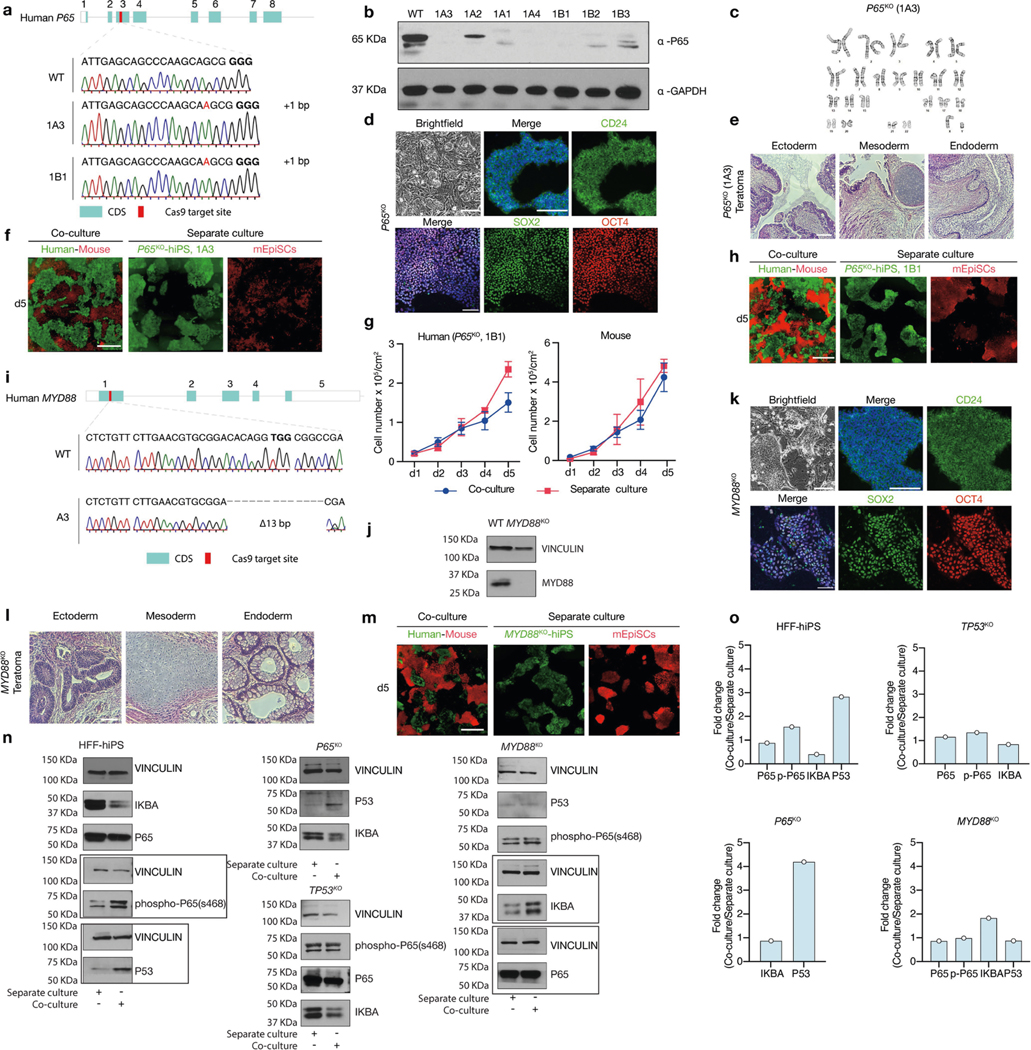
Extended Data Fig. 7 |. Genetic inactivation of P65 and MYD88 in human PSCs overcome human–mouse primed PSC competition.

a, Sanger sequencing results showing out-of-frame homozygous 1-bp insertion in two independent P65KO hiPS cell clones: 1A3 and 1B1. Bold, PAM sequence. b, Western blot analysis confirmed the lack of P65 protein expression in several independent P65KO hiPS cell clones. GAPDH was used as a loading control. c, P65KO hiPS cells (clone 1A3) maintained normal karyotype after long-term passaging (passage 10). d, Representative brightfield and immunofluorescence images showing long-term F/R1-cultured P65KO hiPS cells maintained stable colony morphology and expressed core (SOX2, green; OCT4, red) and primed (CD24, green) pluripotency markers. Blue, DAPI. Scale bars, 200 μm. e, Representative haematoxylin and eosin staining images of a teratoma generated by P65KO hiPS cells (clone 1A3) showing lineage differentiation towards three germ layers. Scale bar, 200 μm. f, Representative fluorescence images of day-5 co-cultured and separately cultured P65KO hiPS cells (green, clone 1A3) and mEpiSCs (red). Scale bar, 400 μm. g, Growth curves of co-cultured (blue) and separately cultured (red) P65KO hiPS cells (clone 1B1) and mEpiSCs. n = 3, biological replicates. Data are mean ± s.e.m. h, Representative fluorescence images of day-5 co-cultured and separately cultured P65KO hiPS cells (clone 1B1, green) and mEpiSCs (red). Scale bar, 400 μm. i, Sanger sequencing result showing out-of-frame homozygous 13-bp deletion in MYD88KO hiPS cells. Bold, PAM sequence. j, Western blot analysis confirmed the lack of MYD88 protein expression in MYD88KO hiPS cells. k, Representative brightfield and immunofluorescence images showing longterm F/R1-cultured MYD88KO hiPS cells maintained stable colony morphology and expressed core (SOX2, green; OCT4, red) and primed (CD24, green) pluripotency markers. Blue, DAPI. Scale bars, 200 μm. l, Representative haematoxylin and eosin staining images of a teratoma generated by MYD88KO hiPS cells showing lineage differentiation towards three germ layers. Scale bar, 200 μm. m, Representative fluorescence images of day-5 co-cultured and separately cultured MYD88KO hiPS cells (green) and mEpiSCs (red). Scale bar, 400 μm. n, Western blot analyses of IKBA, P65, phospho-P65 (s468), P53 protein expression levels in co-cultured and separately cultured wild-type and mutant (P65KO, TP53KO and MYD88KO) HFF-hiPS cells. Vinculin was used as a loading control. Boxed areas were from separate blots. o, Bar graphs showing the fold changes of protein expression levels (shown in n) in co-cultured versus separately cultured wild-type and mutant HFF-hiPS cells. n = 1, biological replicate. Experiments in b, j and n were repeated independently three times with similar results. For gel source data, see Supplementary Fig. 1. Images in d–f, h and k–m are representative of three independent experiments.
