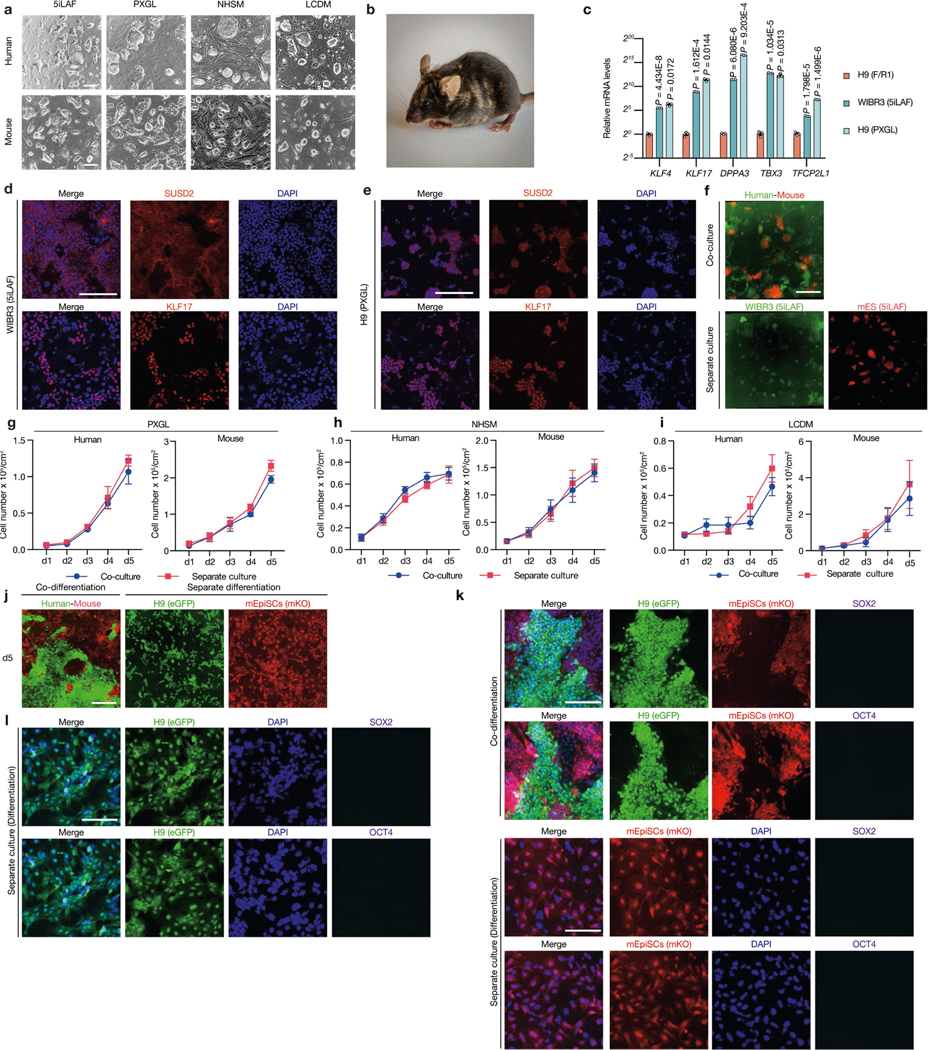
Extended Data Fig. 3 |. Lack of cell competition in human-mouse naive PSC and differentiation co-cultures.

a, Representative brightfield images showing typical colony morphologies of human and mouse PSCs cultured in naive or naive-like (5iLAF, PXGL, NHSM and LCDM) culture conditions. Scale bars, 200 μm. b, A coat-colour chimera generated by J1 mouse ES cells, cultured in 5iLAF medium. c, RT–qPCR analysis of relative expression levels of selected naive pluripotency markers in WIBR3 (5iLAF) and H9 (PXGL) hES cells compared to F/R1-cultured H9-hES cells. n = 3, biological replicates. P values determined by unpaired two-tailed t-test. d, e, Representative immunofluorescence images of SUSD2 and KLF17 in hES cells cultured in 5iLAF (WIRB3) and PXGL (H9) medium. Scale bars, 200 μm. f, Representative fluorescence images of day-5 co-cultured and separately cultured WIBR3 hES cells (green) and J1 mouse ES cells (red) cultured in 5iLAF medium. Scale bar, 400 μm. g, Growth curves of co-cultured (blue) and separately cultured (red) H9-hES cells and J1 mouse ES cells in PXGL medium. n = 3, biological replicates. h, Growth curves of co-cultured (blue) and separately cultured (red) H9-hES cells and mouse ES cells in NHSM medium. n = 3, biological replicates. i, Growth curves of co-cultured (blue) and separately cultured (red) human iPS-EPS (extended pluripotent stem) cells and mouse EPS cells in LCDM medium. n = 3, biological replicates. j, Representative fluorescence images of day-5 co-cultured and separately cultured H9-hES cells (green) and mEpiSCs (red) under a differentiation culture condition. Scale bar, 400 μm. k, l, Representative immunofluorescence images showing H9-hES cells and mEpiSCs under the differentiation culture condition lost expression of pluripotency transcription factors SOX2 (purple) and OCT4 (purple) on day 5. Blue, DAPI. Scale bars, 200 μm. Images in a, d–f and j–l are representative of three independent experiments. All data are mean ± s.e.m.
