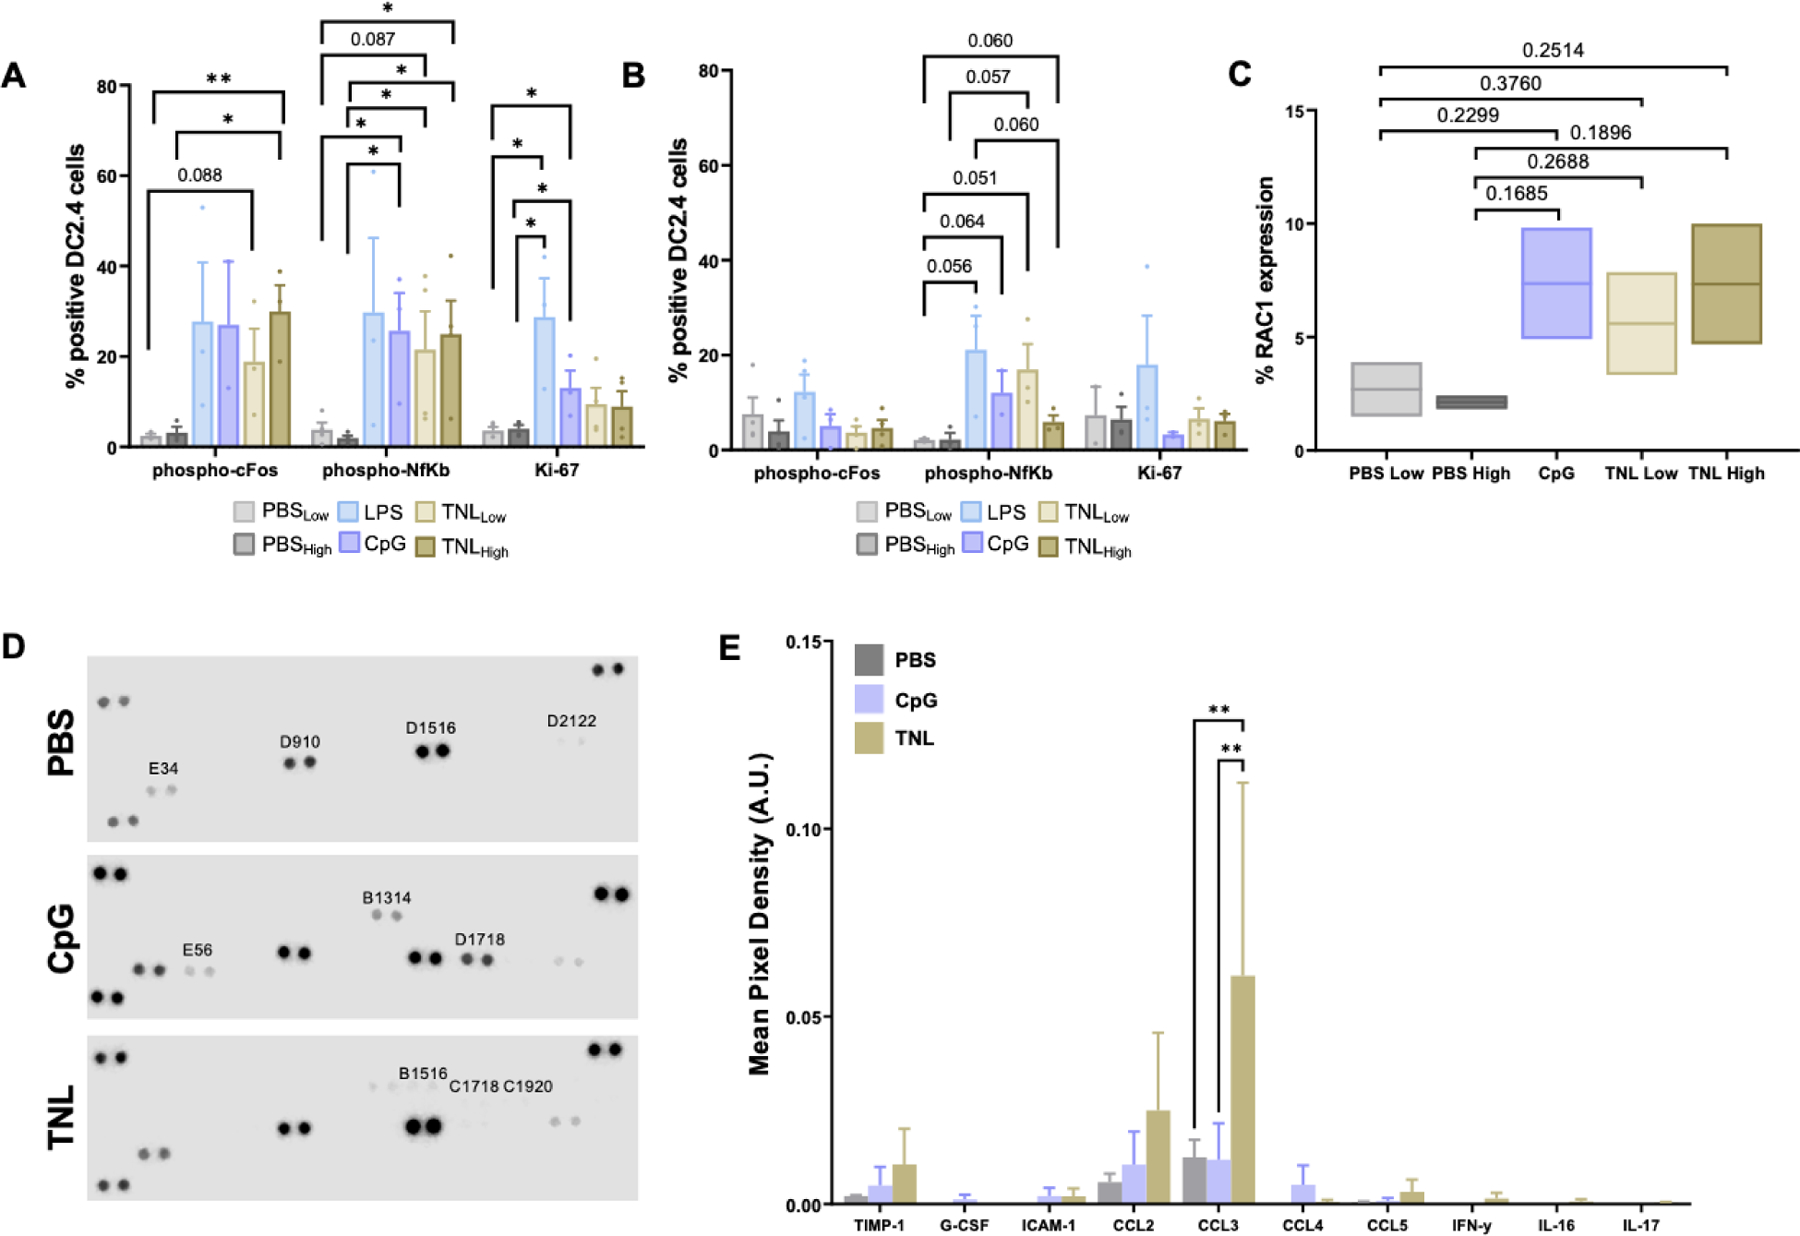
Figure 2. Analysis of DC activation markers.

DC2.4 NF-kB phosphorylation, c-Fos phosphorylation and Ki-67 expression after (A) 4 h and (B) 24 h. (C) Percent RAC1 expression in DC2.4 cells after 24 h compared to costimulatory controls. (D) Representative proteome profiler arrays depicting cytokine release. (E) Cytokine and chemokine release in DC2.4 cells after 24 h. *p<0.05, **p<0.01.
