
Figure 5. In vivo multi-dose TNL study.
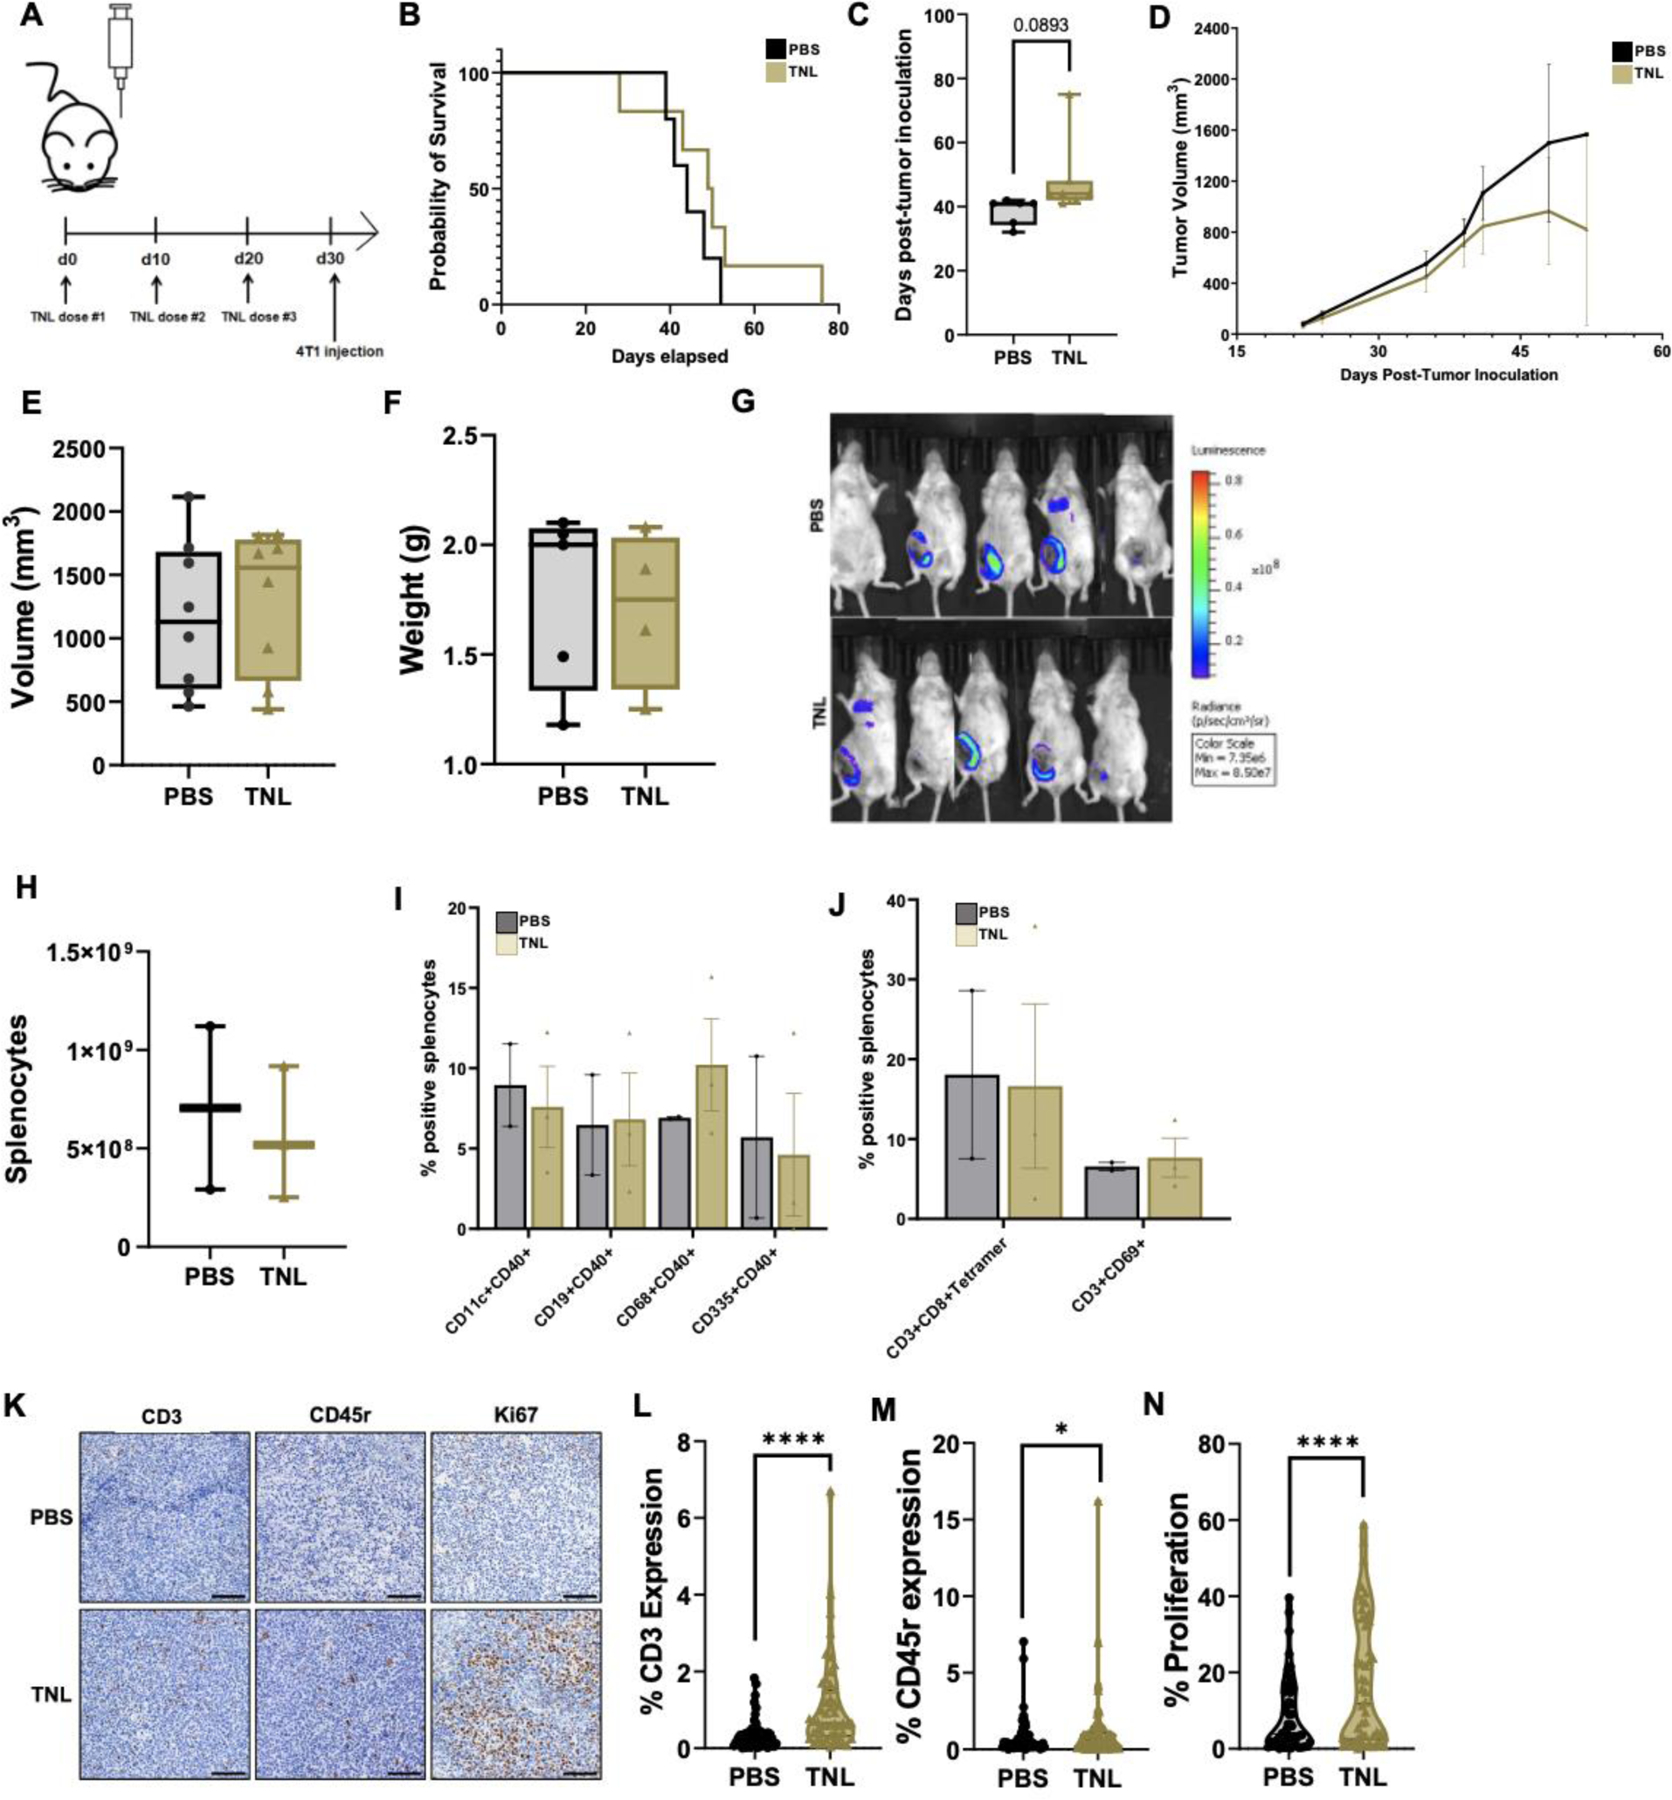
(A) Multi-dose mouse protocol. (B) Survival curves for PBS- and TNL- treated mice. (C) Day of observed metastasis onset following tumor inoculation. (D) Changes in tumor volume over time. (e) Final tumor volume of each mouse. (F) Final tumor weight following resection. (G) Representative bioluminescent imaging (BLI) depicting tumor volume at one sample timepoint. We observed increased luminescence in BLI, indicating increased tumor growth, for PBS-vaccinated mice. (H) Splenocyte population counts. (I) Percent positive splenocyte activation markers and (J) percent positive splenocyte tetramers. (K) Representative immunohistochemistry micrographs. (L) % CD3 expression (M) % CD45r expression and (N) % Proliferation. Scale bar = 100 μm. *p<0.05, ****p<0.001.