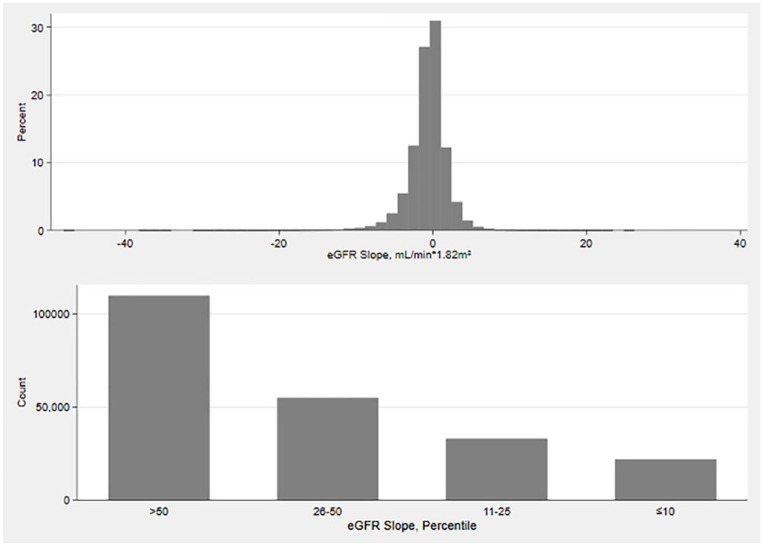
Figure 3.
Distribution of the annual eGFR slope. eGFR estimated glomerular filtration rate. In the top figure, there is the distribution of eGFR slope (mL/min/1.73 m2 per year). In the bottom figure, each participant’s eGFR slope has been classified into 4 percentile bins: >50th percentiles, 26th-50th percentiles, 11th-25th percentiles, and ≤10th percentiles. Only the participants in the >50th percentiles have slopes that increase (as well as decrease). The other three bins only show declines in eGFR. The specific ranges are given in Table 1.

