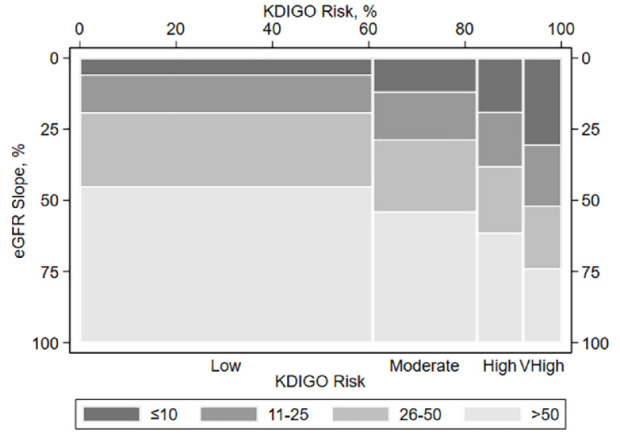
Figure 4.

Joint distribution of KDIGO stage and the annual eGFR slope. CKD, chronic kidney disease; eGFR, estimated glomerular filtration rate; KDIGO, Kidney Disease Improving Global Outcomes. Each participant’s eGFR slope (mL/min/1.73 m2 per year) has been classified into 4 percentile bins: >50th percentiles (lightest gray shading), 26th-50th percentiles (medium-light gray shading), 11th-25th percentiles (medium-dark gray shading), and ≤10th percentiles (darkest gray shading). The largest eGFR declines are those in the ≤10th percentiles bin. The heights of the bars depict the percentage of participants who fall into these eGFR slope percentiles bins. The widths of the bars depict the percentage of participants with four levels of KDIGO risk: low, moderate, high, and very high.
