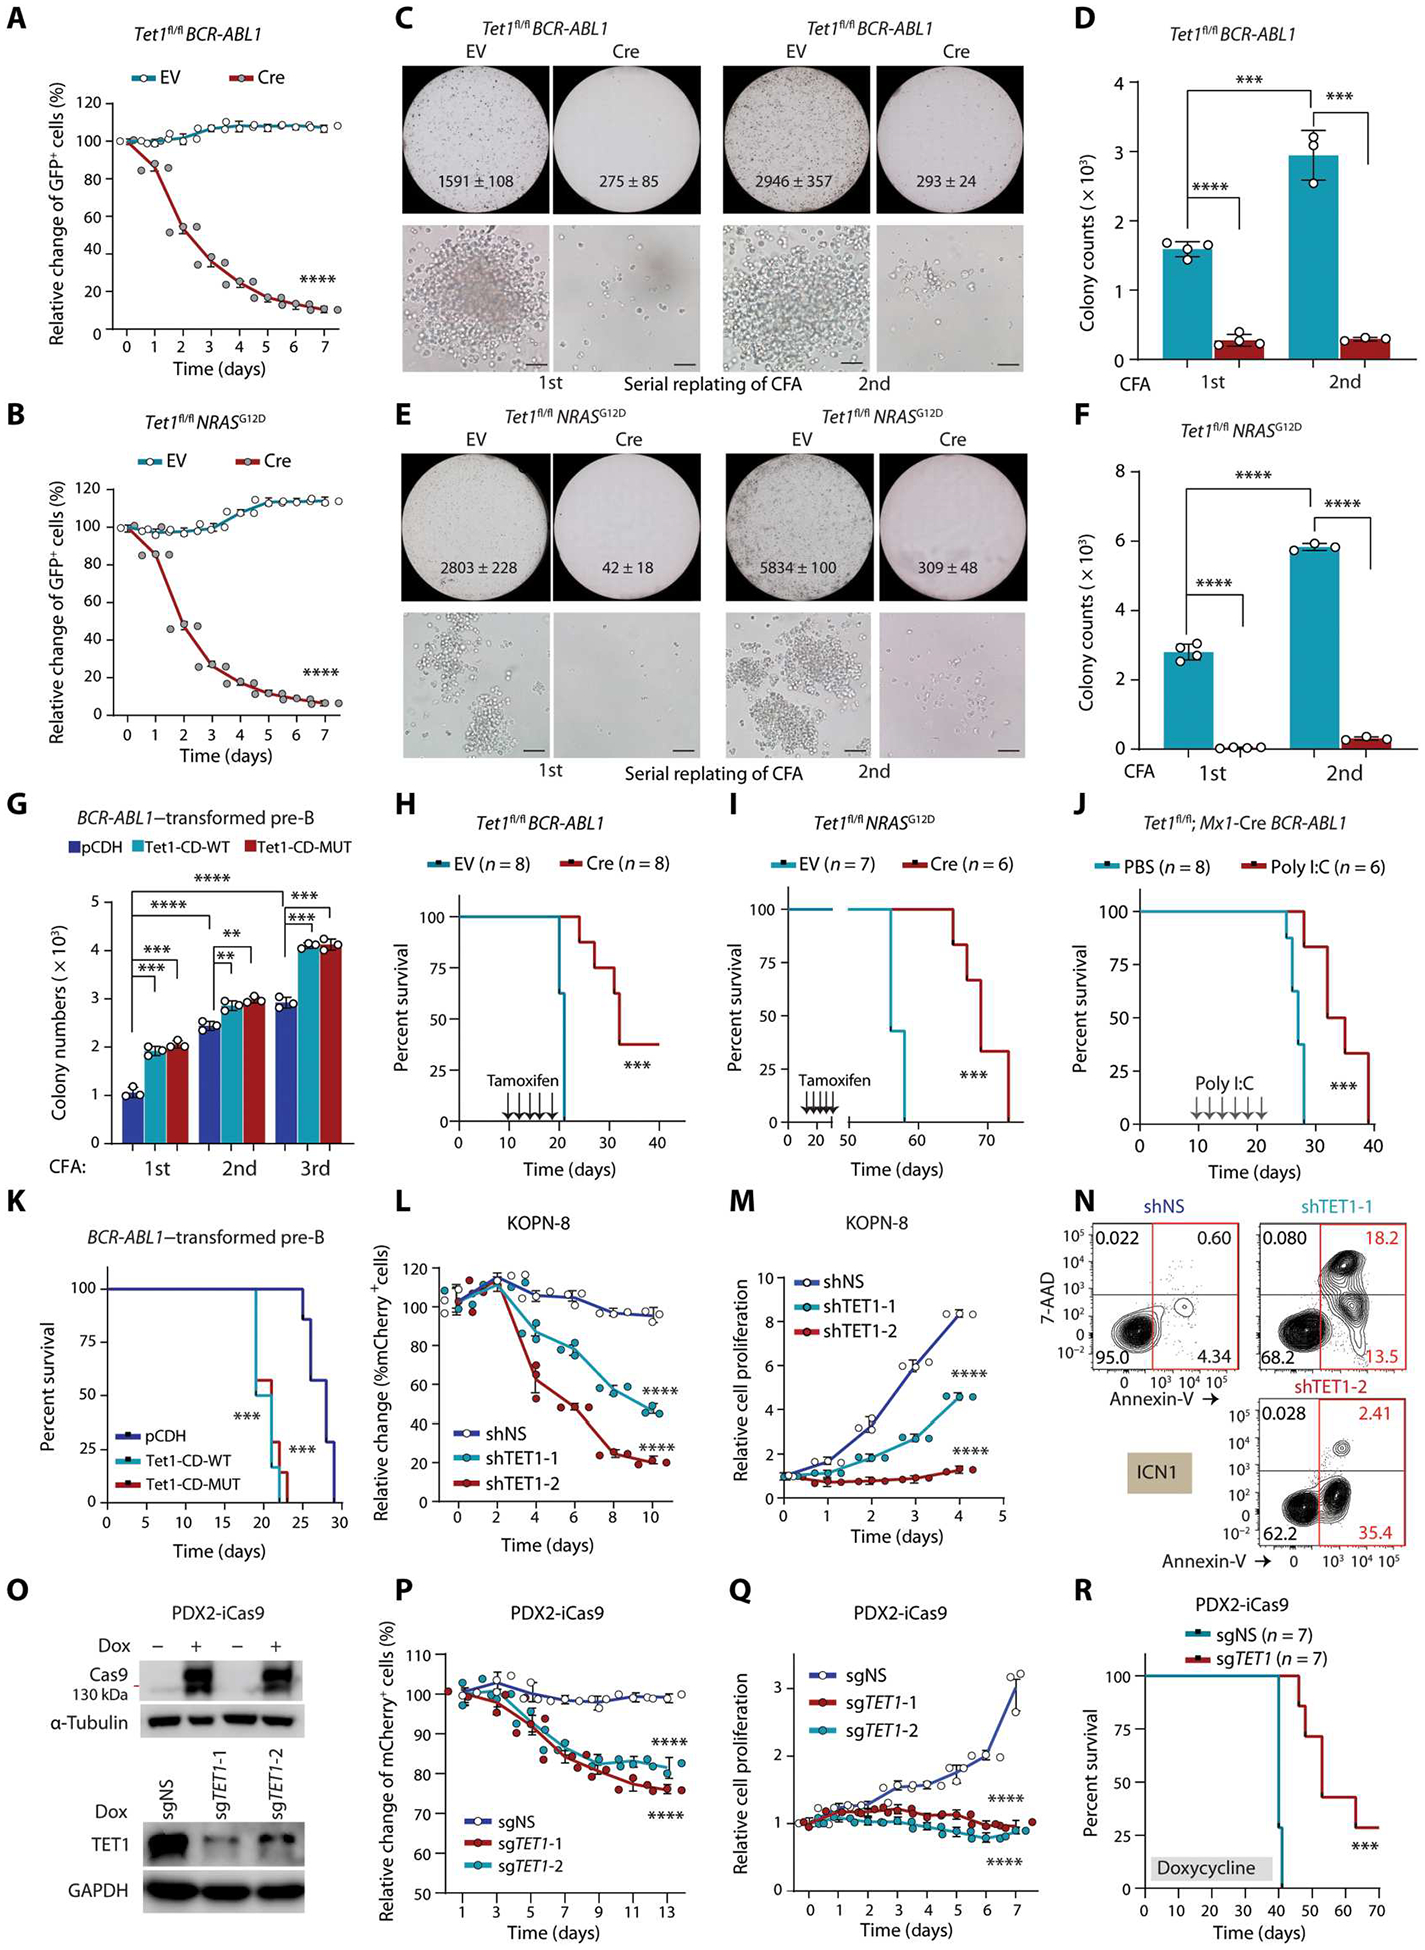
Fig. 1. TET1 promotes pre-B ALL development independent of its catalytic activity.

(A and B) Growth competition assays. BCR-ABL1–transduced (A) or NRASG12D-transduced (B) Tet1fl/fl pre-B cells were further transduced with Cre-ERT2-IRES-GFP vectors (Cre) or ERT2-IRES-GFP (EV). Percentages of GFP+ cells were measured by flow cytometry after 4-hydroxytamoxifen (4-OHT) treatment. (C to F) Colony-forming and replating assays (CFAs) and colony number quantification of BCR-ABL1–transduced (C and D) or NRASG12D-transduced (E and F) Tet1fl/fl pre-B cells (further transduced by EV or Cre) upon 4-OHT treatment. Colony count (mean ± SD) of the whole plate and representative images (scale bar, 50 μm) are shown. (G) Colony number quantification of serial CFAs of BCR-ABL1–transduced pre-B cells co-transduced with pCDH (empty vector), wild-type, or catalytically dead mutant murine Tet1-CD (Tet1-CD-WT or Tet1-CD-MUT). (H and I) Kaplan-Meier curves of immunocompromised NSG mice transplanted with BCR-ABL1–transformed (H) or NRASG12D-transformed (I) Tet1fl/fl pre-B cells transduced with either EV or Cre. Tamoxifen was intraperitoneally injected every other day for 5 days starting 10 days after transplantation. (J) Survival curves of immunocompetent C57BL/6 mice transplanted with BCR-ABL1–trans duced Tet1fl/fl Mx1-Cre pre-B cells coupled with poly I:C or PBS injection (intraperitoneally once every other day for five injections) 10 days after transplantation. (K) Survival curves of immunocompetent C57BL/6 mice transplanted with BCR-ABL1–transduced wild-type pre-B cells with or without overexpression of Tet1-CD-WT or Tet1-CD-MUT. (L) mCherry+ cell populations measured by flow cytometry at indicated time points after transduction with lentiviral shRNA vectors expressing mCherry (psi-LVRU6MH) in KOPN-8 cells (carrying MLL-ENL). shNS, non-silencing control. mCherry+ cell populations were measured every 2 days without any selection. (M and N) Cell growth/proliferation (M) and apoptosis (N) assays in B-ALL cells [KOPN-8 or ICN1 (PDX cells carrying BCR-ABL1)] after TET1 KD by shRNAs. (O) Western blotting showing the inducible effects of CRISPR-Cas9 protein in PDX2 (carrying BCR-ABL1)–inducible Cas9-ZsGreen (iCas9) cells after 3 days of induction with doxycycline (1 μg/m1; Dox, top). Validation of induced TET1 KO in PDX2-iCas9 cells after transfection of lentiviral sgRNAs targeting TET1 (bottom). (P) Growth competition assays of human PDX2 B-ALL cells with or without TET1 knockout (KO). ZsGreen+ PDX2-iCas9 cells were transduced with mCherry+ sgRNAs, and percentages of mCherry+ ZsGreen+ double-positive cells in ZsGreen+ cells were analyzed by flow cytometry. (Q) Cell growth/proliferation assays of control and TET1 KO PDX2 cells. (R) Kaplan-Meier curves of PDX2-iCas9 cell xenograft model. Except for survival analyses, other experimental data are representative of at least three independent experiments. Data are shown as means ± SD and assessed by two-tailed Student’s t test (D, F, and G) or two-way ANOVA (A, B, L, M, P, and Q). Log-rank tests were used for survival analyses (H to K and R). **P < 0.01, ***P < 0.001, and ****P < 0.0001. GAPDH, glyceraldehyde-3-phosphate dehydrogenase.
