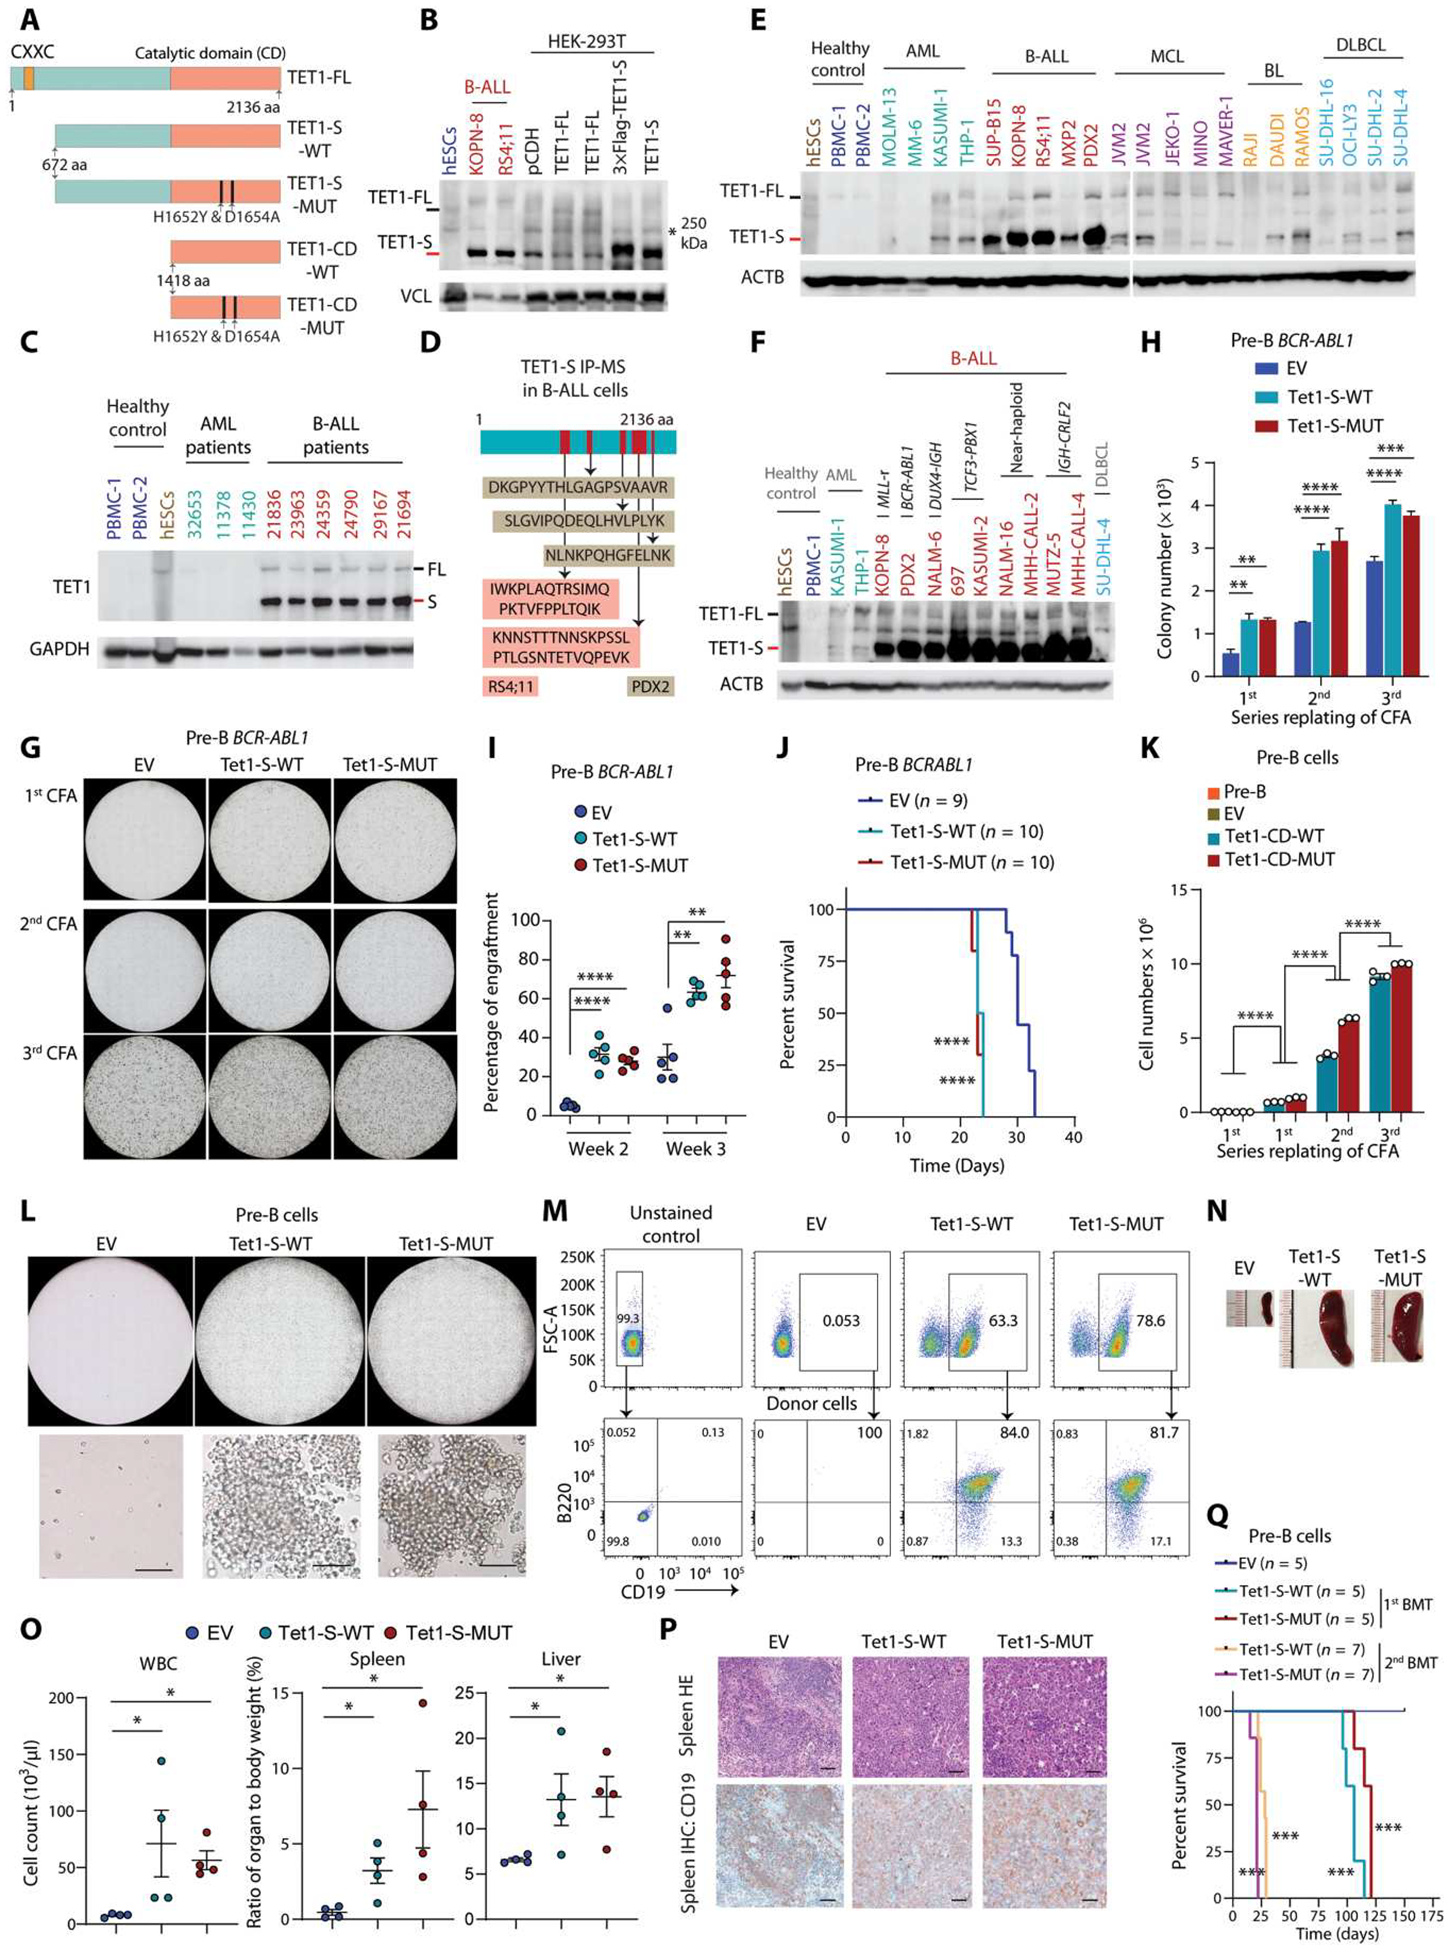
Fig. 2. The TET1-S is highly expressed in B-ALL, and its overexpression is sufficient to transform pre-B cells.

(A) Schematic of full-length (TET1-FL), short isoform (TET1-S), and catalytic domain of TET1 (TET1-CD). (B) Western blots of the TET1-FL (black dash on the left) and TET1-S (red dash on the left) of TET1 in human embryonic stem cells (hESCs), B-ALL cells, and HEK-293T cells with overexpression of empty vector (pCDH), TET1-FL, or TET1-S. Nonspecific bands at 250 kDa are labeled with black stars. Vinculin (VCL) was used as a reference control. (C) Western blotting showing expression of TET1-FL and TET1-S in primary B-ALL patient samples, along with hESCs, peripheral blood mononuclear cells (PBMCs), and AML patient samples as controls. (D) IP with TET1 antibody in B-ALL cell lysate (RS4;11 and PDX2) followed by LC-MS/MS detection and analysis. In-gel protein sample used for LC-MS/MS was collected from the specific band (TET1-S) observed in SDS–polyacrylamide gel electrophoresis gel as shown in (B). (E and F) Western blots showing expression of full-length (black dash) and short isoform (red dash) of TET1 protein in healthy control, different subtypes of B-ALL, and other malignant blood cells [AML, mantle cell lymphoma (MCL), Burkitt lymphoma (BL), and diffuse large B cell lymphoma (DLBCL)]. (G) Representative photomicrographs of serial CFAs. BCR-ABL1–transformed pre-B cells were further transduced with empty vector (EV), Tet-S-WT, or Tet1-S-MUT. (H) Clonal cell number statistics of serial passages of CFAs of BCR-ABL1–transformed pre-B cells further transduced with pCDH, Tet1-S-WT, or Tet1-S-MUT. (I) Engraftment detection by flow cytometry for peripheral blood (PB) samples from C57BL/6 mice transplanted with BCR-ABL1–transformed pre-B cells with or without overexpression of Tet1-S-WT or Tet1-S-MUT at indicated time points. (J) Survival curves of immunocompetent C57BL/6 mice transplanted with BCR-ABL1–transduced wild-type pre-B cells with or without overexpression of Tet1-S-WT or Tet1-S-MUT. (K) Clonal cell number quantification of serial passages of CFAs of pre-B cells transduced with pCDH, Tet1-CD-WT, or Tet1-CD-MUT. (L) Representative photomicrographs of CFAs. Healthy pre-B cells were transduced with EV, Tet-S-WT, or Tet1-S-MUT. Scale bar, 50 μm. (M) Validation of B-ALL by flow cytometry with antibodies of CD45.2 (donor) and murine CD19 and B220. (N) Representative images of spleens from NSG mice transplanted with pre-B cells overexpressing EV, Tet1-S-WT, or Tet1-S-MUT. (O) Cell counts for white blood cells (WBC) and organ weight as a percentage of whole-body weight from leukemic mice at the end time point or from the control group of mice. (P) Representative photomicrographs of splenic tissues stained by hematoxylin and eosin (HE) and immunohistochemistry (IHC) staining for CD19 in mice transplanted by pre-B cells with overexpression of EV, Tet1-S-WT, or Tet1-S-MUT. Scale bar, 50 μm. (Q) Kaplan-Meier curves of NSG mice transplanted with pre-B cells transduced with EV, Tet1-S-WT, or Tet1-S-MUT for two generations of BMT. All experimental data are representative of at least three independent experiments. Data are shown as mean ± SD and assessed by two-tailed Student’s t test (H, I, K, and O). Log-rank test for (J) and (Q). *P < 0.05, **P < 0.01, ***P < 0.001, and ****P < 0.0001.
