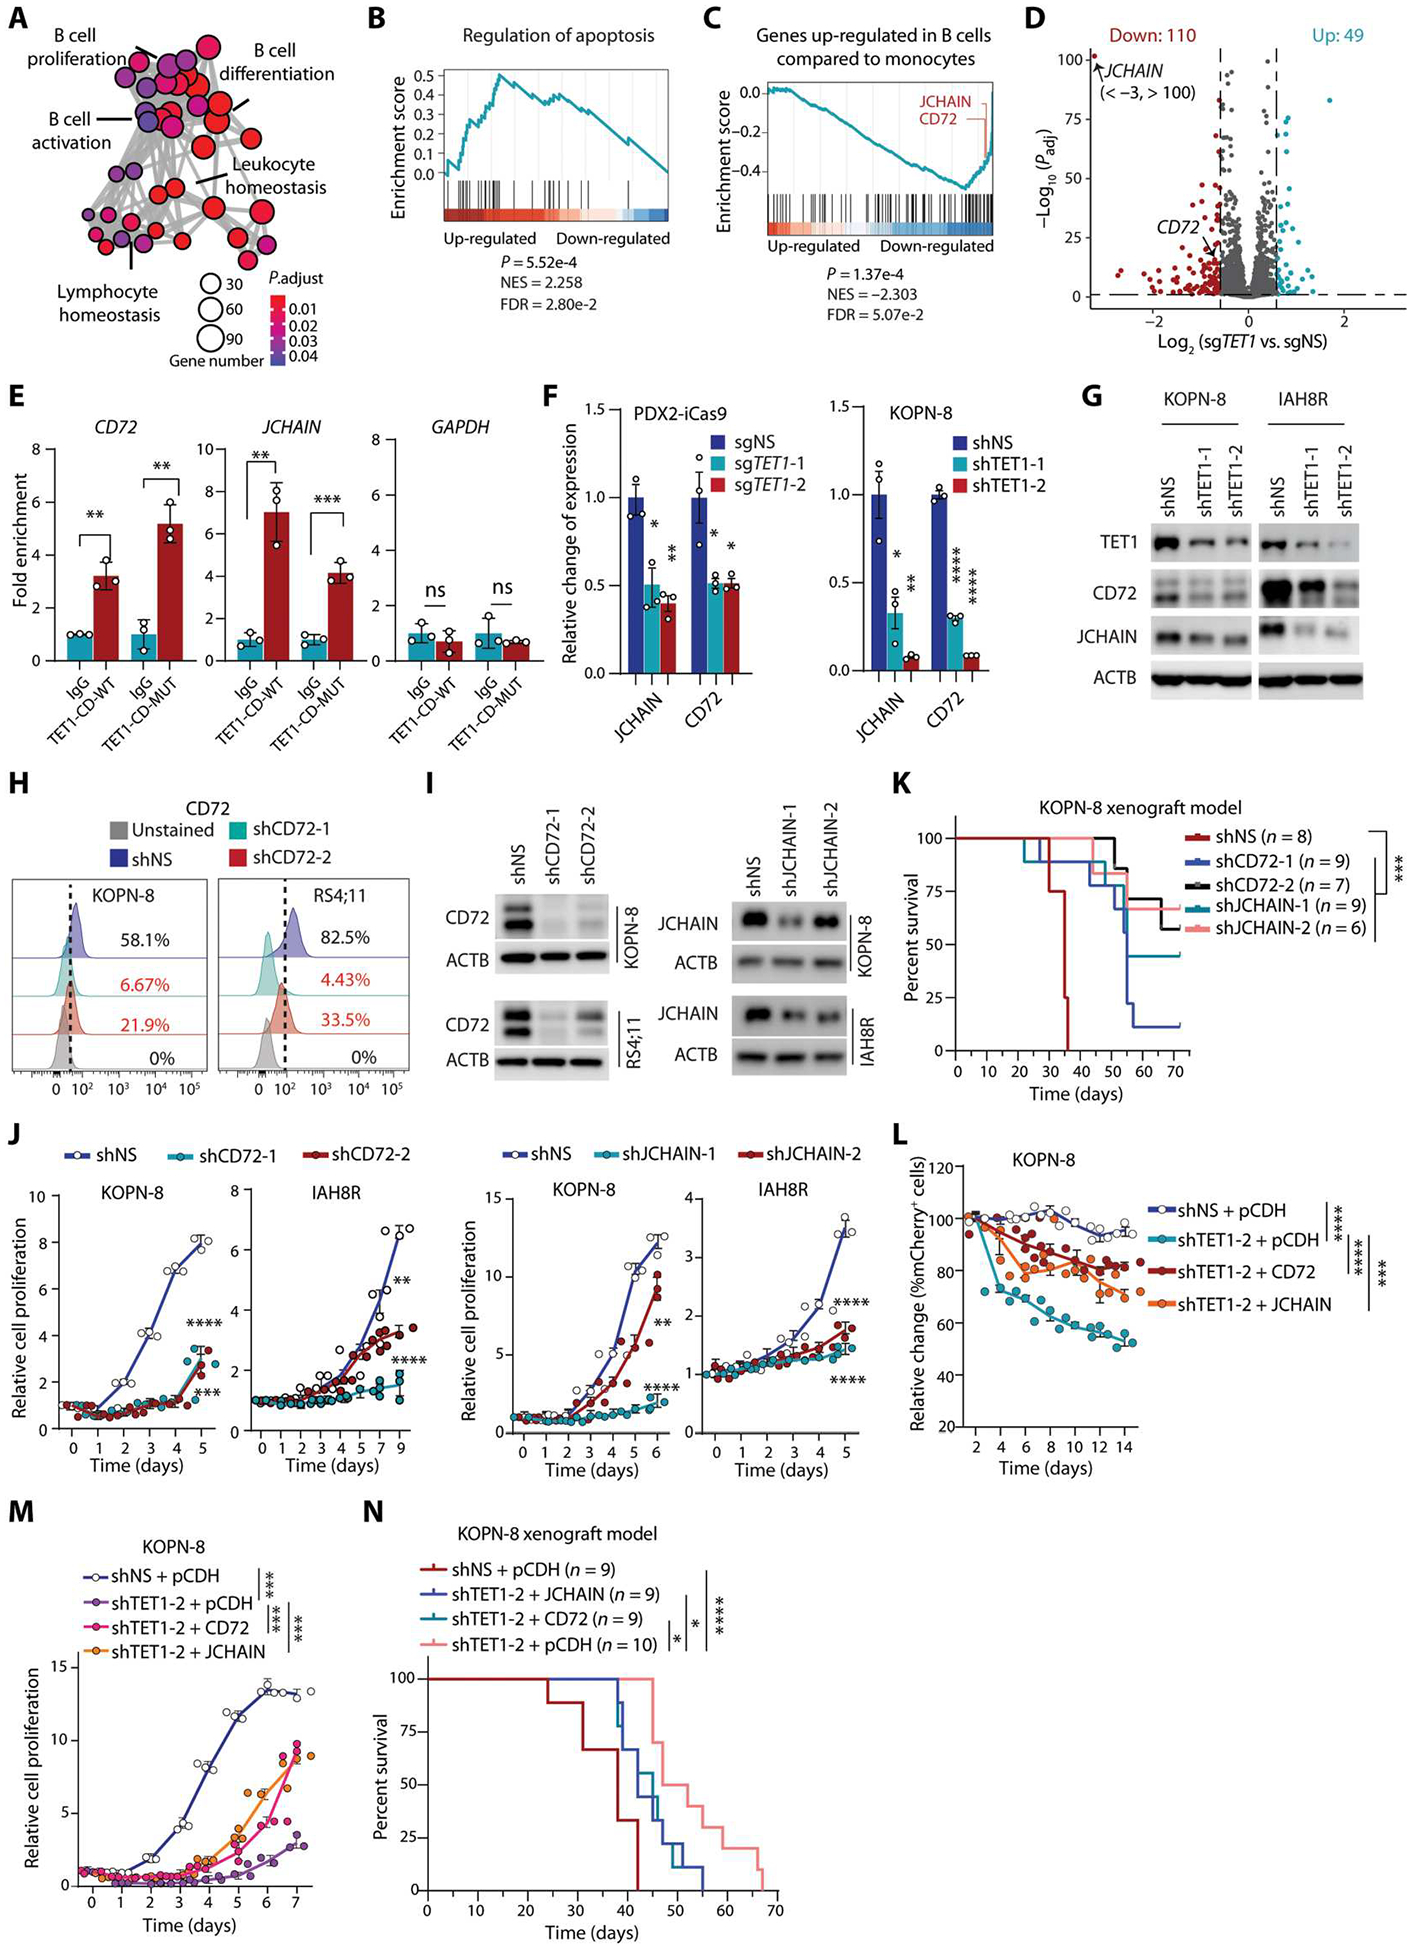
Fig. 4. TET1 drives B-ALL cell growth/survival by promoting transcription of B cell–specific oncogenic targets, such as CD72 and JCHAIN.

(A) Gene Ontology (GO) analysis of down-regulated genes upon TET1 KO in PDX2 cells, which are enriched in B cell pathways. Size of circle indicates gene number; color shows the adjusted P value. (B and C) Gene Set Enrichment Analysis (GSEA) plots of apoptosis (B) and genes up-regulated in B cells compared with monocytes (GSE29618) (C) using a preranked TET1-CD-WT/MUT–bound gene list weighted by expression fold change in TET1-depleted PDX2 compared with control PDX2 cells. (D) Volcano plot showing expression changes in TET1-CD WT/MUT–bound genes upon TET1 KO in PDX2 cells. Dots in red (down-regulation) and blue (up-regulation) represent significantly differentially expressed genes. (E) ChIP-qPCR showing the binding of both TET1-CD-WT and TET1-CD-MUT on CD72 and JCHAIN genomic loci in PDX2 cells. ChIP-qPCR of GAPDH as a negative control for TET1 ChIP. (F and G) Changes in CD72 and JCHAIN mRNA expression (F) or protein (G) abundance upon TET1 KO or knockdown (KD) in B-ALL cells (PDX2, KOPN-8, and IAH8R). (H) CD72 cell surface expression tested by flow cytometry after CD72 KD in B-ALL cells. (I) Protein abundance changes in CD72 or JCHAIN after shRNA KD. (J) Cell growth/proliferation assays after KD of CD72 or JCHAIN in B-ALL cells. (K) Kaplan-Meier analysis (log-rank test) of NSG mice xenotransplanted with human KOPN-8 B-ALL cells with or without KD of CD72 or JCHAIN. (L) Cell population analysis of mCherry+ versus GFP+ in TET1 KD (shRNA vectors carrying mCherry) KOPN-8 cells after overexpression of CD72-GFP, JCHAIN-GFP, or pCDH-GFP in vitro. (M) Cell growth/proliferation assays of control and TET1 KD KOPN-8 cells with or without overexpression of CD72 or JCHAIN. (N) Kaplan-Meier curves (log-rank test) of KOPN-8–xenotransplanted NSG mice showing the effects of CD72 or JCHAIN overexpression on rescuing TET1 KD–induced inhibition on B-ALL progression. All experimental data are representative of at least three independent experiments. Data are shown as mean ± SD and assessed by two-tailed Student’s t test (E and F) or two-way ANOVA (J, L, and M). *P < 0.05, **P < 0.01, ***P < 0.001, ****P < 0.0001, and ns, not significant.
