Abstract
The expression of BMI‐1 is correlated with disease progression in cancer patients. We showed that ectopic expression of BMI‐1 in B‐cell lymphoma cell lines, HT and RL, conferred resistance to etoposide and oxaliplatin, known to enhance sensitivity by targeting the survivin gene, but not to irinotecan, which is not relevant to the downregulation of survivin expression. The expression of survivin was not only augmented in cells transduced with BMI‐1, but persisted in the presence of etoposide in cells overexpressing BMI‐1. By contrast, the mock‐transduced cells succumbed in the medium with anticancer drugs, with an accompanying decrease in BMI‐1 and survivin expression. BMI‐1 overexpression stabilized survivin post‐translationally without an accompanying rise in the mRNA, suggesting survivin as a potential target for BMI‐1. Knockdown of either BMI‐1 or survivin restored sensitivity to etoposide in the BMI‐1‐overexpressing lymphoma cells. An analysis of six patients with B‐cell lymphoma showed that in the drug‐resistant patients, levels of BMI‐1 and survivin were maintained even after drug administration. However, downregulation of both BMI‐1 and survivin expression was observed in the drug‐sensitive patients. Therefore, BMI‐1 might facilitate drug resistance in B‐cell lymphoma cells through the regulation of survivin. BMI‐1 could be an important prognostic marker as well as a future therapeutic target in the treatment of drug‐resistant lymphomas. (Cancer Sci 2012; 103: 34–41)
Polycomb‐group (PcG) genes were originally identified as epigenetic gene silencers, which play an important role during embryogenesis. Several were recognized as oncogenes and their products were found to be deregulated in cancer cells.( 1 , 2 ) BMI‐1, a member of the PcG complex, was initially detected as a factor cooperating with c‐Myc in a murine model of lymphomagenesis.( 3 ) BMI‐1 plays a key role in regulating self‐renewing hematopoietic stem cells and leukemic stem cells. It might maintain the stem cell pool by preventing premature senescence either through repression of the Ink4A locus, which encodes a cyclin‐dependent kinase inhibitor, P16INK4A, and a p53 regulator, P19ARF, or through the re‐expression of telomerase to prevent telomere shortening. This shows a potential role for BMI‐1 in the prevention of apoptosis,( 1 , 4 ) suggesting that it could confer drug resistance. In fact, a line of studies have indicated that BMI‐1 expression is correlated with disease progression or prognosis.( 5 , 6 , 7 , 8 , 9 ) Although BMI‐1 is highly expressed in malignant tumors, its relationship with drug resistance has not been fully elucidated.
Survivin has been identified as a member of the inhibitors of apoptosis protein (IAP) family, and is known to function either as an inhibitor for apoptosis or as a regulator of cell division.( 10 , 11 , 12 ) Overexpression of survivin induces resistance to anticancer drugs.( 10 , 13 , 14 , 15 , 16 ) Levels of survivin are correlated with the aggressiveness of tumors and a poor prognosis in colorectal cancers, melanomas, breast carcinomas and acute myeloid leukemia. Inhibition of survivin suppresses the growth activity of aggressive non‐Hodgkin’s lymphomas.( 14 ) In addition, overexpression of survivin is considered to be a risk factor for resistance to chemotherapy and radiation treatment. Lack of survivin also causes polyploidy and apoptosis during cell division. Here, we report that the level of BMI‐1 expression is positively correlated with drug resistance through the stabilization of survivin expression in B‐cell lymphoma cells.
Materials and Methods
Plasmid construction. BMI‐1 cDNA was synthesized from total RNA of 380 cells (ATCC, Manassas, VA, USA). This cDNA was amplified through RT‐PCR using BMI‐1 primers (5′‐AATCCCCACCTGATGTGTGT‐3′; 5′‐CCGATCCAATCTGTTCTGGT‐3′). The expression cassettes, BMI‐1 cDNA and Flag tag sequence were subcloned into the vector MSCV‐IRES‐GFP provided by the St. Jude Shared Resource (Memphis, TN, USA) to create the plasmid MSCV‐BMI‐1‐Flag‐IRES‐GFP.
Cell culture. B‐cell lymphoma cell lines (HT and RL) and Jurkat cells were obtained from ATCC. Peripheral blood cells were obtained from a healthy donor. Primary B‐cell lymphoma cells were obtained from lymph nodes, bone marrow aspirate and ascites. Lymph node samples, which were minced with scissors, and bone marrow samples were subjected to Ficoll density centrifugation. Informed consent was obtained from all the patients and the donor. Our study was approved by the Hiroshima University institutional review board. Cells were cultured in RPMI‐1640 medium plus 10% FCS supplemented with penicillin and streptomycin (Sigma, St. Louis, MO, USA) at 37°C.
Transfection and viral transduction. To generate a RD114‐pseudotyped retrovirus, Lipofectamine‐2000 (Invitrogen, Carlsbad, CA, USA) was used to transfect HEK‐293T cells with the MSCV‐BMI‐1‐Flag‐IRES‐GFP, pEQ‐PAM3(‐E) and pRDF (St. Jude). To generate a VSVG‐pseudotyped retrovirus containing MSCV‐BMI‐1‐Flag‐IRES‐GFP or MSCV‐IRES‐GFP alone, Plat‐A cells, which were kindly provided by Dr T. Kitamura (Institute of Medical Science, University of Tokyo, Japan), were infected with viral supernatant containing polybrene (Sigma). Transduced cells were selected in the presence of 1 μg/mL of puromycin and 10 μg/mL of blasticidin. Viral supernatant from Plat‐A cells was used to infect lymphoma cell lines. GFP‐positive cells were sorted by FACS Aria (BD, San Jose, CA, USA).
Western blot analysis. Cells were lysed and analyzed by western blotting, as described previously.( 6 ) The primary antibodies used were the anti‐Bmi‐1 antibody, anti‐survivin antibody (Upstate Cell Signaling Solutions, Lake Placid, NY, USA), anti‐X‐linked inhibitor of apoptosis protein (XIAP), Bcl‐x and Bcl‐2 antibodies (BD), and anti‐β‐actin antibody (Santa Cruz Biotechnology, Santa Cruz, CA, USA). Blots were probed with an anti‐mouse secondary antibody, HRP. The proteins were detected by enhanced chemiluminescence (GE Healthcare Life Sciences, Buckinghamshire, UK).
RT‐PCR. BMI‐1 and survivin mRNA expression were amplified through RT‐PCR for 30 cycles using primers for BMI‐1 (5′‐AATCCCCACCTGATGTGTGT‐3′; 5′‐CCGATCCAATCTGTTCTGGT‐3′), survivin (5′‐GGACCACCGCATCTCTACAT‐3′; 5′‐TCTCCGCAGTTTCCTCAAAT3′) and β‐actin (5′‐ATCTGGCACCACACCTTCTACAATGAGCTGCG‐3′; 5′‐CGTCATACTCCTGCTTGCTGATCCACATCTGC‐3′).
Cell viability and detection of apoptosis. Etoposide, oxaliplatin and irinotecan were purchased from Sigma. After drug treatment, they were stained with a trypan blue solution (Invitrogen) and viable cells were counted under a light microscope to determine cell viability. At least 200 cells were counted in triplicate. The apoptotic assay was carried out using a Cy5‐Annexin V kit (BD), according to directions.
Short hairpin RNA (shRNA) and transduction. Lentiviral particles harboring BMI‐1‐short hairpin RNA (shRNA) (pLKO.1‐puro BMI‐1 shRNA) or survivin‐shRNA (pLKO.1‐puro survivin shRNA) were purchased from Sigma. The knockdown of BMI‐1 and survivin in HT cells was achieved by the transduction of the viral particles followed by selection with puromycin (1 μg/mL). Non‐silencing shRNA was used as a control.
Statistical analysis. The unpaired Students t‐test was used to compare means between groups. A P‐value < 0.001 was considered statistically significant.
Results
Establishment of cell lines stably overexpressing BMI‐1. We established HT and RL (B‐cell lymphoma) cell lines, which have very little endogenous BMI‐1, stably overexpressing BMI‐1 by retroviral transduction with MSCV‐BMI‐1‐Flag‐IRES‐GFP as a vector. Western blotting revealed that BMI‐1 was highly expressed in HT and RL cells transduced with BMI‐1 (HT‐BMI‐1 and RL‐BMI‐1), compared to the MSCV‐Flag‐IRES‐GFP (mock)‐transduced cells (HT‐mock and RL‐mock) (Fig. 1).
Figure 1.
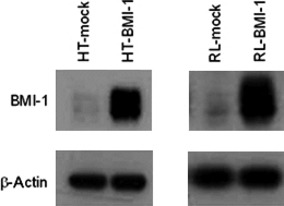
Establishment of a BMI‐1‐expressing cell line. Protein samples were isolated from mock‐transduced HT cells (HT‐mock) and HT cells transduced with BMI‐1 (HT‐BMI‐1). Total protein was electrophoresed and separated on a 10% SDS polyacrylamide gel. The BMI‐1 protein expression was detected by western blotting.
Overexpression of BMI‐1 induced resistance to etoposide and oxaliplatin, but not to irinotecan in B‐cell lymphoma cell lines. To determine whether overexpression of BMI‐1 leads to an increase in resistance to drug‐induced apoptosis, etoposide, oxaliplatin and irinotecan were tested in our assay system in vitro. The number of HT or RL cells harvested was comparable to that of HT or RL cells transduced with BMI‐1 without anticancer drug, respectively (data not shown). Bmi‐1 is known to play a role for sustaining growth activity by repressing the INK4A locus encoding p16INK4A and p19ARF.( 1 , 2 , 3 , 4 , 5 , 6 , 7 , 8 , 9 , 10 , 11 , 12 , 13 , 14 , 15 , 16 , 17 , 18 , 19 ) However, the transduction of BMI‐1 did not affect cell growth at all in our settings (Fig. S1). Next, HT‐BMI‐1 and HT‐mock cells were treated with etoposide at two different concentrations (8 and 16 μg/mL) and oxaliplatin at two different concentrations (10 and 15 μM) for 72 h. RL‐BMI‐1 and RL‐mock cells were similarly treated with etoposide or oxaliplatin at a variety of concentrations for 72 h. Every 24 h, cells were counted under a microscope after being stained with trypan blue dye. Interestingly, overexpression of BMI‐1 significantly decreased apoptotic cells in HT and RL cells after exposure to etoposide or oxaliplatin (Fig. 2). However, there was no significant difference in apoptosis after treatment with irinotecan (data not shown). A flow cytometric analysis with Cy5‐Annexin V was performed every 24 h for 72 h after the treatment with the respective drugs. As shown in Figure 3(a), the survival rate of HT‐mock cells at 24 h was 35.19 ± 1.06% (mean ± SD), with 8 μg/mL of etoposide. However, that of HT‐BMI‐1 cells was 63.66 ± 0.49% (P < 0.001). Similarly, there was a significant difference in apoptosis in response to etoposide between HT‐BMI‐1 and HT‐mock at 48 and 72 h. These results showed that HT cells overexpressing BMI‐1 were relatively more resistant to etoposide.
Figure 2.
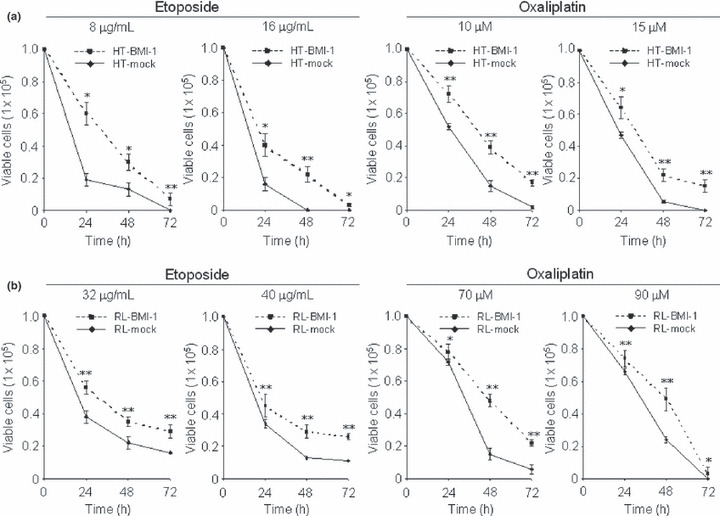
B‐cell lymphoma cell lines overexpressing BMI‐1 are resistant to anticancer drugs. (a) Trypan blue exclusion assays of HT‐BMI‐1 and HT‐mock cells after etoposide treatment (8 and 16 μg/mL) and after oxaliplatin treatment (10 and 15 μM) for 24–72 h. (b) Similar assays of RL‐BMI‐1 and RL‐mock cells after etoposide (32 and 40 μg/mL) and oxaliplatin (70 and 90 μM) treatment for 24–72 h. Cells (1 × 10⁵/mL) were plated in a six‐well plate and treated with varying doses of drugs. Every 24 h, cells were counted under a microscope after staining with trypan blue dye. All results were tested in triplicate. *<0.05; **<0.001.
Figure 3.
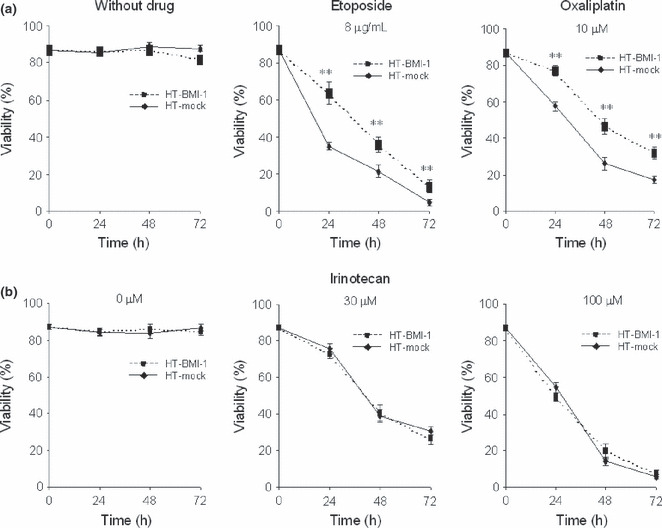
Upregulation of BMI‐1 expression protects B‐cell lymphoma cells from drug‐induced apoptosis. (a) Flow cytometric analysis with Cy5‐Annexin V. The percentage of viable cells is shown. HT‐mock cells and HT‐BMI‐1 cells were treated with etoposide (0 or 8 μg/ml) for 24–72 h. Similarly, the cells were treated with oxaliplatin at 0 μM, and 10 μM for 24–72 h. (b) HT‐mock cells and HT‐BMI‐1 cells treated with irinotecan at 0, 30 and 100 μM for 24–72 h. The percentage of cells displaying Annexin V−/FSC+ (viable cells) was determined using flow cytometry. **<0.001.
Next, HT cells were treated with oxaliplatin, and subjected to the apoptosis assay described above. As shown in Figure 3(a), after 24 h of exposure, the survival rate of HT‐mock cells was 57.64 ± 0.55% with 10 μM of oxaliplatin. By contrast, that of HT‐BMI‐1 cells was 77.31 ± 0.12% (P < 0.001). Likewise, we found that HT‐BMI‐1 cells were significantly more resistant to oxaliplatin than HT‐mock cells at 48 and 72 h. These results revealed the survival of HT‐BMI‐1 cells to be significantly augmented even in the presence of oxaliplatin compared to that of HT‐mock cells, which is consistent with the cell viability data obtained from the trypan blue exclusion assay. However, there was no significant difference in survival between HT‐BMI‐1 and HT‐mock cells exposed to irinotecan (Fig. 3b). These results indicate that upregulation of BMI‐1 expression in B‐cell lymphoma cells confers resistance to anticancer drugs, such as etoposide and oxaliplatin, but not to irinotecan. Similar results were obtained with RL‐BMI‐1 and RL‐mock cells (data not shown).
BMI‐1 overexpression upregulated survivin expression. Previous published studies indicate that treatment with etoposide( 13 , 16 ) and oxaliplatin,( 10 , 20 , 21 ) but not with irinotecan, leads to inhibition of cellular growth by targeting the survivin gene. These results prompted us to examine a role for survivin in BMI‐1‐induced drug resistance. Western blotting showed a definite increase in levels of survivin in HT‐BMI‐1 and RL‐BMI‐1 cells compared to HT‐mock and RL‐mock cells, respectively (Fig. 4). However, there was no significant increase in other proteins involved in drug resistance, such as XIAP, Bcl‐2, and Bcl‐x in HT‐BMI‐1 and RL‐BMI‐1 cells (Fig. 4). Although a gene chip analysis was conducted to compare the mRNA expression profiles of genes associated with anti‐apoptosis between BMI‐1‐transduced and mock‐transduced HT and RL cells, we could not, unfortunately, identify any significant upregulated genes in the cells transduced with BMI‐1 (data not shown). Enhancement of survivin protein expression, in contrast, was detected by western blotting, suggesting that survivin is a candidate for a target of BMI‐1 in inducing the drug resistance. Interestingly, RL cells overexpressing BMI‐1 was significantly more resistant to etoposide than HT cells overexpressing BMI‐1 (Fig. 2), which might be explained by the expression of Bcl‐2 in collaboration with survivin.
Figure 4.
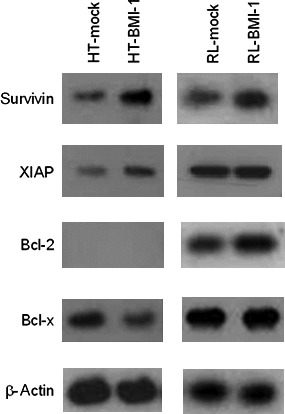
BMI‐1 overexpression upregulated survivin expression. Protein samples were isolated from HT‐mock, HT‐BMI‐1, RL‐mock and RL‐BMI‐1 cells. Proteins involved in drug resistance were detected by western blotting. The expression of survivin in HT‐BMI‐1 and RL‐BMI‐1 cells was significantly increased compared to that in mock‐transduced cells.
BMI‐1 and survivin expression was maintained in the presence of etoposide in BMI‐1‐overexpressing cells. We monitored the expression of survivin and BMI‐1 during exposure to anticancer drugs by western blotting. Levels of both proteins declined significantly 24 h after treatment with etoposide in HT‐mock cells. By contrast, BMI‐1 and survivin were highly expressed in HT‐BMI‐1 cells even after treatment with etoposide (Fig. 5). A flow cytometric analysis with the anti‐survivin antibody also detected an increased level of survivin in HT‐BMI‐1 cells, which remained elevated in the presence of etoposide even after 72 h (data not shown).
Figure 5.
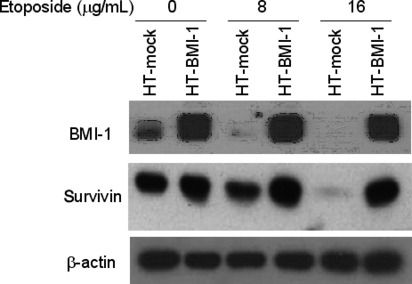
Sustained expression of BMI‐1 and survivin following drug treatment in BMI‐1‐overexpressing cells. Western blot analysis of HT‐mock and HT‐BMI‐1 cells expressing BMI‐1 and survivin 24 h after drug treatment. The cells (1 × 10⁵/mL) were plated and treated with various doses of etoposide. At 24 h, they were harvested and subjected to western blotting.
Overexpression of BMI‐1 stabilized survivin expression post‐translationally. Next, we investigated mRNA levels for survivin in HT and RL cells by RT‐PCR and real‐time PCR (RQ‐PCR). We could not, however, detect a significant difference in the levels of survivin mRNA between BMI‐1‐transduced and mock‐transduced cells (Fig. 6a). RQ‐PCR confirmed that there was no significant difference in survivin mRNA levels between BMI‐1‐transduced and mock‐transduced cells, consistent with the gene‐chip data (Fig. S2). Accordingly, we presumed that expression of the survivin protein was enhanced in cells transduced with BMI‐1 through post‐translational regulation. Previous studies indicate that survivin is ubiquitinated in vitro and that the ubiquitin–proteasome pathway is involved in the post‐translational regulation of survivin.( 22 ) Intriguingly, an 8‐h incubation with a proteasomal inhibitor, MG132, at 10 or 20 μM augmented the expression of survivin in HT‐mock cells (data not shown). A 16‐h incubation with MG132 at 20 μM also augmented the expression in RL‐mock cells (Fig. 6b). However, survivin expression was not affected at the mRNA level by the inhibitor (data not shown). By contrast, the expression of survivin in BMI‐1‐transduced cells was unchanged in the presence of MG132. The induced protein expression, despite the invariable mRNA expression in BMI‐1‐overexpressing cells, suggests that BMI‐1 is involved in the post‐translational stabilization of survivin.
Figure 6.
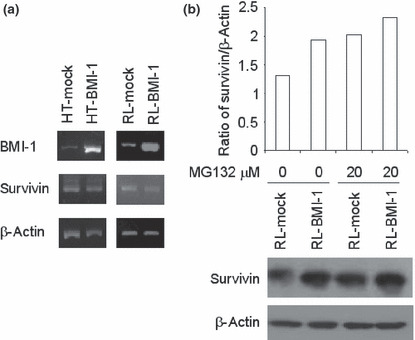
Overexpression of BMI‐1 stabilizes survivin expression post‐translationally. (a) BMI‐1, survivin and β‐actin mRNA expression in BMI‐1‐transduced and mock‐transduced HT and RL cells determined by RT‐PCR. (b) The proteasomal inhibitor MG132 stabilized the expression of survivin in mock‐transduced cells. RL‐mock cells (1 × 10⁵) were plated and treated with 20 μM of MG132 for 16 h. Densitometric analyses on ratio of survivin expression/β‐actin are shown in the upper panel. Western blotting pictures on survivin expression are shown in the lower panel.
Knockdown of BMI‐1 downregulated survivin expression, which decreased cell viability after exposure to chemotherapeutic drugs in B‐cell lymphoma cells. To determine whether BMI‐1 regulates the expression of survivin, HT‐BMI‐1 cells were transduced with a lentiviral vector carrying BMI‐1‐shRNA (HT‐BMI‐1‐shRNA) or a control‐shRNA (HT‐BMI‐1‐mock). Western blotting also showed that the expression of BMI‐1 was downregulated by more than 50% in HT‐BMI‐1‐shRNA cells (Fig. 7a). As expected, knockdown of BMI‐1 led to a simultaneous decrease in the expression of the survivin protein. RT‐PCR showed a significant reduction in the BMI‐1 mRNA level (HT‐BMI‐1‐shRNA) (Fig. 7b). However, the mRNA expression for survivin in HT‐BMI‐1‐shRNA cells was consistent with that in HT‐BMI‐1‐mock cells (Fig. 7b and Fig. S2). These results indicate that BMI‐1 might be an upstream regulator for survivin and that it stabilizes its expression post‐translationally.
Figure 7.
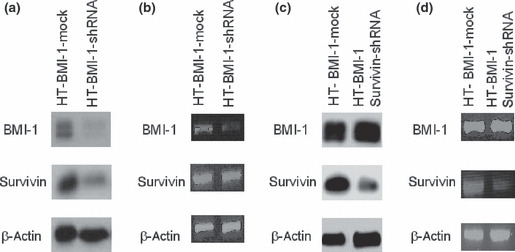
Expression of survivin and BMI‐1 in survivin‐knockdown and BMI‐1‐knockdown cells. (a) Protein samples isolated from HT‐BMI‐1‐mock cells and HT‐BMI‐1‐shRNA cells. The BMI‐1 and survivin proteins were detected by western blotting. (b) BMI‐1, survivin and β‐actin mRNA expression in HT‐BMI‐1‐mock cells and HT‐BMI‐1‐shRNA cells determined by RT‐PCR. (c) Lysate from HT‐BMI‐1‐mock cells as well as HT‐BMI‐1 survivin‐shRNA cells was subjected to SDS‐PAGE followed by western blotting to detect survivin and BMI‐1. (d) BMI‐1, survivin and β‐actin mRNA expression in HT‐BMI‐1‐mock cells and HT‐BMI‐1 survivin‐shRNA determined by RT‐PCR.
HT‐BMI‐1‐mock cells and HT‐BMI‐1‐shRNA cells were treated with etoposide at a variety of concentrations, and the apoptosis assay was performed every 24 h for 72 h. The percentage of viable cells in the right lower quadrant was much higher in HT‐BMI‐1‐mock cells than BMI‐1‐knockdown cells (HT‐BMI‐1‐shRNA) (Fig. 8a), suggesting that BMI‐1 might act as an upstream regulator for survivin, a key factor inducing drug resistance, in B‐cell lymphoma cells with high levels of BMI‐1.
Figure 8.
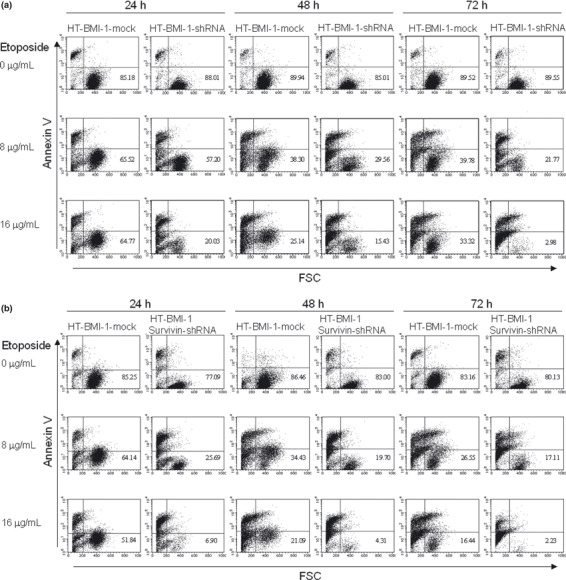
BMI‐1‐knockdown reduces cell viability similar to survivin‐knockdown. (a) Flow cytometric analysis with Cy5‐Annexin V and FSC. The percentage of viable cells in the right lower quadrant is shown. HT‐BMI‐1‐shRNA cells were treated with etoposide for 24–72 h. HT‐BMI‐1‐mock cells were used as a control. (b) The same experiment but with HT‐BMI‐1 survivin‐shRNA cells. The percentage of cells displaying Annexin V−/FSC+ in the right lower quadrant (viable cells) was determined using flow cytometry.
Survivin knockdown, similar to BMI‐1 knockdown, decreased cell viability after exposure to chemotherapeutic drugs in B‐cell lymphoma cells. The stable knockdown of survivin was achieved after HT‐BMI‐1 cells were lentivirally transduced with survivin shRNA (HT‐BMI‐1 survivin‐shRNA). Western blotting showed that HT‐BMI‐1 survivin‐shRNA caused a significant reduction in the expression of survivin in HT‐BMI‐1 cells, while BMI‐1 expression (HT‐BMI‐1‐mock) was not affected (Fig. 7c). RT‐PCR results showed a significant reduction in the survivin mRNA level (Fig. 7d). To see the effect of the knockdown of survivin on cell viability, the apoptosis assay was performed. Similar to the knockdown of BMI‐1, that of survivin also led to lower cell viability after exposure to anticancer drugs (Fig. 8b). We found the percentage of viable cells to be almost the same following the knockdown of BMI‐1 or survivin, suggesting that BMI‐1 might be an upstream regulator for survivin.
Sustained expression of BMI‐1 and survivin correlated with drug resistance in patients with B‐cell lymphoma. To confirm the findings described above, we examined BMI‐1 and survivin expression in specimens from six patients diagnosed with B‐cell non‐Hodgkin’s lymphoma. Three of the patients were clinically resistant to chemotherapy (patient 1–3), whereas three were sensitive (patients 4–6). Profiles of the patients are summarized in Table 1. We analyzed the expression of BMI‐1 and survivin in samples from both groups after culturing in medium with or without etoposide for 24 h. Interestingly, BMI‐1 and survivin levels remained higher in samples from the chemotherapy‐resistant patients (Fig. 9a) in spite of etoposide treatment, whereas it was significantly lower in those from the chemotherapy‐sensitive patients, as shown in Figure 9(b). Furthermore, flow cytometry also showed that expression of survivin in CD19‐positive lymphoma cells was higher in the chemotherapy‐resistant patients (data not shown). BMI‐1 expression might, therefore, contribute to drug resistance in B‐cell lymphoma cells from patients through the induction of survivin expression.
Table 1.
Patients’ profile
| Group | Patient no. | Gender | Pathology | Site | Age | CS | Therapy | Response | Outcome |
|---|---|---|---|---|---|---|---|---|---|
| Resistant | 1 | Male | MCL | BM | 82 | IVA | R‐CHOP, R‐HyperCVAD | NC | Dead |
| 2 | Male | MCL | Ascites | 58 | IVA | R‐CHOP, R‐HyperCVAD | PD | Dead | |
| 3 | Male | DLBCL | LN | 54 | IVA | R‐CHOP | PD | Dead | |
| Sensitive | 4 | Male | FL | BM | 75 | IVA | R‐CHOP | CR | Alive |
| 5 | Male | DLBCL | LN | 61 | IIIA | R‐CHOP | CR | Alive | |
| 6 | Male | DLBCL | LN | 77 | IIIA | R‐CHOP | CR | Alive |
BM, bone marrow; CR, complete remission; CS, clinical stage; DLBCL, diffuse large B‐cell lymphoma; FL, follicular lymphoma; LN, lymph node; MCL, mantle cell lymphoma; NC, no change; PD, progressive disease; R‐CHOP, rituximab‐cyclophosphamide, hydroxydoxorubicin, vincristine and prednisolone; R‐HyperCVAD, rituximab‐hyperfractional cyclophosphamide, vincristine, adriamycin and dexamethasone.
Figure 9.
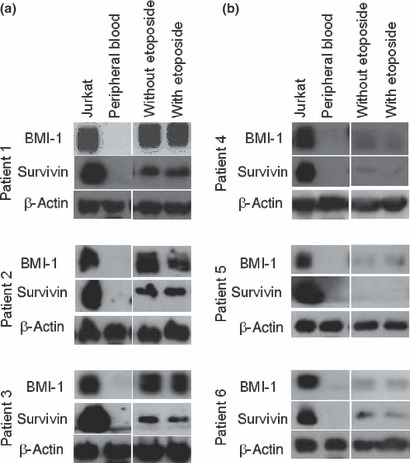
Sustained expression of BMI‐1 and survivin following drug administration is correlated with drug resistance in B‐cell lymphoma patients. Western blot analysis of samples from three resistant patients (1–3) (a) and three sensitive patients (4–6) (b) showing the expression of BMI‐1 and survivin. Mononuclear cells (1 × 10⁶) from patients were cultured for 24 h with 0 μg/mL (lane 3) or 1 μg/mL of etoposide (lane 4). Lysate from treated cells was subjected to SDS‐PAGE followed by western blotting. Jurkat cells were chosen as a positive control (lane 1) and peripheral blood cells (lane 2) were used as a negative control.
Discussion
Approximately half of patients with B‐cell non‐Hodgkin’s lymphoma treated with standard chemotherapy experience disease progression and treatment failure.( 23 ) It is frequently observed that tumor cells exhibit plasticity, adapt to toxic stimuli and survive, even in unfavorable environments in response to cellular stress, by acquiring resistance to apoptosis through the overexpression of drug resistance genes or loss of cell‐death effectors. Several studies have indicated that overexpression of BMI‐1 correlates with prognosis in patients with hepatocellular carcinoma and acute myeloid leukemia. In this study, we found that enhanced BMI‐1 expression led to increased cell survival in response to chemotherapeutic agents through elevated levels of anti‐apoptotic proteins in B‐cell lymphomas.
The B‐cell lymphoma cell lines overexpressing BMI‐1 were resistant to etoposide and oxaliplatin, but not to irinotecan (2, 3). We conducted a genechip analysis to compare mRNA expression profiles between BMI‐1‐transduced and mock‐transduced cells. However, we could not identify any significant upregulated anti‐apoptotic genes in BMI‐1 transduced cells (data not shown). Previous studies found that etoposide( 13 , 16 ) and oxaliplatin,( 10 , 20 , 21 ) but not irinotecan, led to inhibition of cellular growth by targeting survivin. We found that the ectopic expression of BMI‐1 induced overexpression of survivin, leading to resistance to chemotherapy in B‐cell lymphoma cells. The mRNA level for survivin was not, however, elevated by BMI‐1 overexpression in HT and RL cells, while the protein level was increased. Thus, our results suggest that BMI‐1 might be an upstream regulator of survivin. It might also regulate survivin post‐translationally to inhibit apoptosis, giving rise to prolonged cell survival.
Survivin expression is stabilized post‐translationally in BMI‐1‐overexpressing cells, as shown in the current study. Survivin is known to be degraded through the ubiquitin–proteasome system in the G1 phase of the cell cycle, but is stable when bound to heat shock protein 90 (Hsp90).( 24 ) Dissociation of the survivin–Hsp90 complex results in the proteasomal‐mediated degradation of survivin, mitochondrial‐dependent apoptosis, and cell cycle arrest with mitotic defects. This chaperone‐like function of Hsp90 is required to stabilize survivin and loss of survivin after Hsp90 inhibition leads to the proteasomal‐dependent degradation.( 25 ) In fact, the results of the genechip analysis indicated a significant increase of Hsp90 mRNA expression in BMI‐1‐overexpressing cells (data not shown), which might be one of the molecular mechanisms causing the stabilization of survivin to induce cell viability. Considering the previous finding that BMI‐1 composes Polycomb complex 1, which acts as an E3 ubiquitin ligase for histone H2A, giving rise to transcriptional repression through the histone code, there might be another molecule responsible for the transcriptional upregulation of the Hsp90 gene in BMI‐1‐overexpressing cells. Overexpression of BMI‐1 might indirectly regulate survivin. However, further detailed analysis is required for elucidating the molecular mechanism underlying the BMI‐1‐mediated stabilization of the survivin protein.
Previous studies have demonstrated that patients with mantle cell lymphoma (MCL) showed resistance to chemotherapy through overexpression of cyclin D1 protein. BMI‐1 regulates cell cycle and senescence through the regulation of cyclin D1.( 26 , 27 ) BMI‐1 silencing inhibits the entry of cells into the S phase and, therefore, suppresses cell growth. On silencing BMI‐1, the expression of cyclin D1, cyclin dependent kinase (CDK)2 and CDK4 were decreased, whereas the level of p21 was increased.( 27 ) BMI‐1 expression does increase expression of cdk2 and cdk4, and the level of cyclin D1 is also enhanced.( 26 ) Thus, BMI‐1 can influence cell cycle progression via these cell cycle regulators. We noted that BMI‐1 protein was reportedly highly expressed in MCL cells compared to other low/intermediate grade lymphomas. Therefore, the patients with MCL might have poor prognosis compared with those with diffuse large B‐cell lymphoma and follicular lymphoma.
Taken together, our results imply that overexpression of a Polycomb‐group protein, BMI‐1, causes drug resistance in B‐cell non‐Hodgkin’s lymphoma through stabilized expression of survivin. Anticancer drugs might exert anti‐apoptotic effects due to sustained expression of BMI‐1 and survivin, whereas cells with a lower level of BMI‐1 undergo apoptosis due to the subsequent downregulation of survivin expression in vitro. According to previous insights, BMI‐1 suppresses transcription at the INK4A locus, leading to a loss of the expression of P16INK4A and/or P19ARF, which are involved in the regulation of cell cycling as well as apoptosis. Therefore, BMI‐1 might orchestrate an enhancement of malignancy or drug resistance.
Recently, survivin was indicated to be a potential new target for apoptosis‐based treatment of cancers and lymphomas.( 28 ) Because overexpression of survivin is considered a risk factor for successful chemotherapy, our results suggest that BMI‐1 might be an upstream regulator of survivin and that depletion of BMI‐1 could be a potential clinical strategy for cancer chemotherapy. Our study could provide important information for predicting the prognosis of cancer and also a novel rationale for further designing more effective chemotherapy.
Disclosure Statement
The authors have no competing financial interest to declare.
Supporting information
Fig. S1. The number of B‐cell lymphoma cell lines overexpressing BMI‐1 harvested is comparable to that of parental cells without anticancer drug.
Fig. S2. Real‐time PCR of BMI‐1 and survivin mRNA.
Supporting info item
Supporting info item
Acknowledgments
We thank N. Nakaju, S. Fukumoto and R. Matsumoto for technical assistance. A Grant‐in‐aid for Scientific Research supported this work.
References
- 1. Raaphorst FM. Deregulated expression of Polycomb‐group oncogenes in human malignant lymphomas and epithelial tumors. Hum Mol Genet 2005; 14: R93–100. [DOI] [PubMed] [Google Scholar]
- 2. Jacobs JJ, van Lohuizen M. Polycomb repression: from cellular memory to cellular proliferation and cancer. Biochim Biophys Acta 2002; 1602: 151–61. [DOI] [PubMed] [Google Scholar]
- 3. Haupt Y, Alexander WS, Barri G et al. Novel zinc finger gene implicated as myc collaborator by retrovirally accelerated lymphomagenesis in E mu‐myc transgenic mice. Cell 1991; 65: 753–63. [DOI] [PubMed] [Google Scholar]
- 4. Park IK, Morrison SJ, Clarke MF. Bmi1, stem cells, and senescence regulation. J Clin Invest 2004; 113: 175–9. [DOI] [PMC free article] [PubMed] [Google Scholar]
- 5. Chowdhury M, Mihara K, Yasunaga S et al. Expression of Polycomb‐group (PcG) protein BMI‐1 predicts prognosis in patients with acute myeloid leukemia. Leukemia 2007; 21: 1116–22. [DOI] [PubMed] [Google Scholar]
- 6. Bhattacharyya J, Mihara K, Yasunaga S et al. BMI‐1 expression is enhanced through transcriptional and posttranscriptional regulation during the progression of chronic myeloid leukemia. Ann Hematol 2009; 88: 333–40. [DOI] [PubMed] [Google Scholar]
- 7. Mihara K, Chowdhury M, Nakaju N et al. Bmi‐1 is useful as a novel molecular marker for predicting progression of myelodysplastic syndrome and patient prognosis. Blood 2006; 107: 305–8. [DOI] [PubMed] [Google Scholar]
- 8. Song LB, Li J, Liao WT et al. The polycomb group protein Bmi‐1 represses the tumor suppressor PTEN and induces epithelial‐mesenchymal transition in human nasopharyngeal epithelial cells. J Clin Invest 2009; 119: 3626–36. [DOI] [PMC free article] [PubMed] [Google Scholar]
- 9. Mohty M, Yong AS, Szydlo RM et al. The polycomb group BMI1 gene is a molecular marker for predicting prognosis of chronic myeloid leukemia. Blood 2007; 110: 380–3. [DOI] [PubMed] [Google Scholar]
- 10. Yamamoto H, Ngan CY, Monden M. Cancer cells survive with survivin. Cancer Sci 2008; 99: 1709–14. [DOI] [PMC free article] [PubMed] [Google Scholar]
- 11. Altieri DC. Survivin in apoptosis control and cell cycle regulation in cancer. Prog Cell Cycle Res 2003; 5: 447–52. [PubMed] [Google Scholar]
- 12. Altieri DC. Validating survivin as a cancer therapeutic target. Nat Rev Cancer 2003; 3: 46–54. [DOI] [PubMed] [Google Scholar]
- 13. Hayashi N, Asano K, Suzuki H et al. Adenoviral infection of survivin antisense sensitizes prostate cancer cells to etoposide in vivo. Prostate 2005; 65: 10–19. [DOI] [PubMed] [Google Scholar]
- 14. Ansell SM, Arendt BK, Grote DM et al. Inhibition of survivin expression suppresses the growth of aggressive non‐Hodgkin’s lymphoma. Leukemia 2004; 18: 616–23. [DOI] [PubMed] [Google Scholar]
- 15. Blanc‐Brude OP, Mesri M, Wall NR et al. Therapeutic targeting of the survivin pathway in cancer: initiation of mitochondrial apoptosis and suppression of tumor‐associated angiogenesis. Clin Cancer Res 2003; 9: 2683–92. [PubMed] [Google Scholar]
- 16. Zaffaroni N, Daidone MG. Survivin expression and resistance to anticancer treatments: perspectives for new therapeutic interventions. Drug Resist Updat 2002; 5: 65–72. [DOI] [PubMed] [Google Scholar]
- 17. Quelle DE, Zindy F, Ashmun RA, Sherr CJ. Alternative reading frames of the INK4a tumor suppressor gene encode two unrelated proteins capable of inducing cell cycle arrest. Cell 1995; 83: 993–1000. [DOI] [PubMed] [Google Scholar]
- 18. Jacobs JJ, Kieboom K, Marino S et al. The oncogene and Polycomb‐group gene bmi‐1 regulates cell proliferation and senescence through the ink4a locus. Nature 1999; 397: 164–8. [DOI] [PubMed] [Google Scholar]
- 19. Smith KS, Chanda SK, Lingbeek M et al. Bmi‐1 regulation of INK4A‐ARF is a downstream requirement for transformation of hematopoietic progenitors by E2a‐Pbx1. Mol Cell 2003; 12: 393–400. [DOI] [PubMed] [Google Scholar]
- 20. Lin J, Hsiao PW, Chiu TH, Chao JI. Combination of cyclooxygenase‐2 inhibitors and oxaliplatin increases the growth inhibition and death in human colon cancer cells. Biochem Pharmacol 2005; 70: 658–67. [DOI] [PubMed] [Google Scholar]
- 21. Fujie Y, Yamamoto H, Ngan CY et al. Oxaliplatin, a potent inhibitor of survivin, enhances paclitaxel‐induced apoptosis and mitotic catastrophe in colon cancer cells. Jpn J Clin Oncol 2005; 35: 453–63. [DOI] [PubMed] [Google Scholar]
- 22. Zhao J, Tenev T, Martins LM et al. The ubiquitin‐proteasome pathway regulates survivin degradation in a cell cycle‐dependent manner. J Cell Sci 2000; 113: 4363–71. [DOI] [PubMed] [Google Scholar]
- 23. Coiffier B. Effective immunochemotherapy for aggressive non‐Hodgkin’s lymphoma. Semin Oncol 2004; 31: 7–11. [PubMed] [Google Scholar]
- 24. Fortugno P, Beltrami E, Plescia J et al. Regulation of survivin function by Hsp90. Proc Natl Acad Sci USA 2003; 100: 13791–6. [DOI] [PMC free article] [PubMed] [Google Scholar]
- 25. Sato S, Fujita N, Tsuruo T. Modulation of Akt kinase activity by binding to Hsp90. Proc Natl Acad Sci USA 2000; 97: 10832–7. [DOI] [PMC free article] [PubMed] [Google Scholar]
- 26. Lee K, Adhikary G, Balasubramanian S et al. Expression of Bmi‐1 in epidermis enhances cell survival by altering cell cycle regulatory protein expression and inhibiting apoptosis. J Invest Dermatol 2008; 128: 9–17. [DOI] [PMC free article] [PubMed] [Google Scholar]
- 27. Song W, Tao K, Li H et al. Bmi‐1 is related to proliferation, survival and poor prognosis in pancreatic cancer. Cancer Sci 2011; 101: 1754–60. [DOI] [PMC free article] [PubMed] [Google Scholar]
- 28. Ambrosini G, Adida C, Altieri DC. A novel anti‐apoptosis gene, survivin, expressed in cancer and lymphoma. Nat Med 1997; 3: 917–21. [DOI] [PubMed] [Google Scholar]
Associated Data
This section collects any data citations, data availability statements, or supplementary materials included in this article.
Supplementary Materials
Fig. S1. The number of B‐cell lymphoma cell lines overexpressing BMI‐1 harvested is comparable to that of parental cells without anticancer drug.
Fig. S2. Real‐time PCR of BMI‐1 and survivin mRNA.
Supporting info item
Supporting info item


