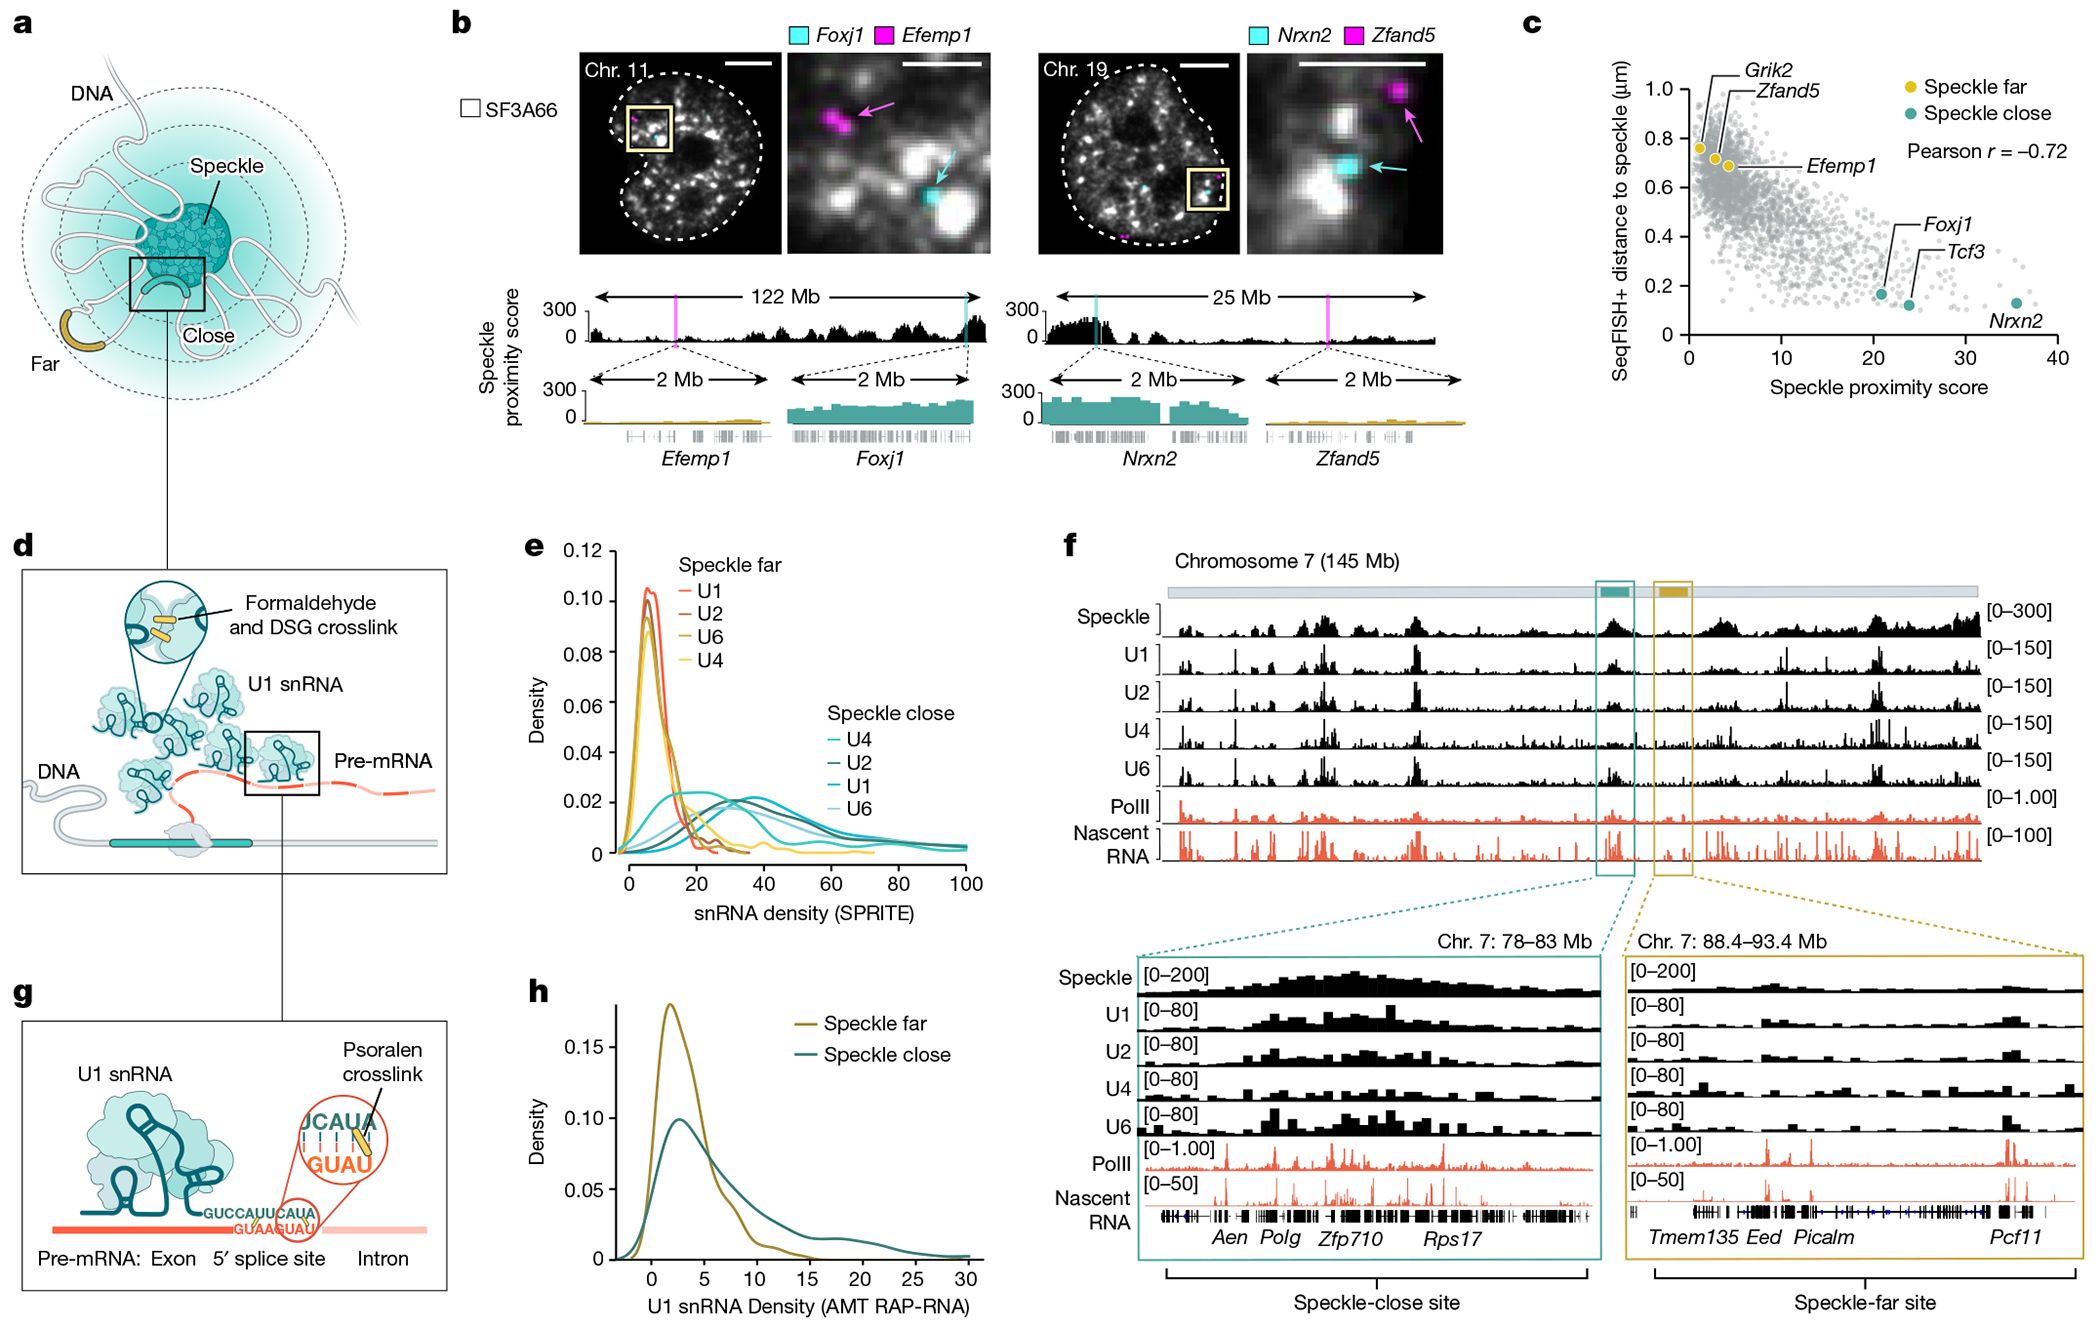
Fig. 1 |. snRNAs preferentially bind pre-mRNAs of genes that are close to speckles.

a, Schematic of DNA regions close to (blue) or far from (yellow) nuclear speckles. b, Top, two reconstructed images of DNA seqFISH+ and immunofluorescence (SF3a66) in mouse ES cells comparing speckle-close (Foxj1 and Nrxn2) and speckle-far (Efemp1 and Zfand5) genes. Images are maximum-intensity z projected for a 1 μm section. White lines represent nuclear segmentation. Scale bars, 2.5 μm (zoom-in) or 5μm (zoom-out). Bottom, speckle proximity scores from SPRITE data for the corresponding genomic regions at 100-kb resolution. Zoom-in regions show speckle proximity scores for a specific genomic region (2 Mb) visualized by seqFISH+. n = 446 cells from two seqFISH+biological replicates from ref. 38. c, Genome-wide comparison of seqFISH+ distance to the periphery of a speckle (determined by microscopy) and SPRITE speckle proximity score (determined by sequencing) for 2,460 paired regions. d, Schematic of U1–DNA contacts measured by SPRITE. Formaldehyde and DSG crosslinked nucleic acids and proteins and SPRITE measure the number of molecules within each crosslinked complex. e, Density of U1, U2, U4 and U6 snRNA contacts across 100-kb genomic bins for speckle-close and speckle-far genomic regions. The distributions are quantile-normalized to have the same range as U1 to enable visualization of all snRNAs on the same scale. f, Speckle proximity scores at 100-kb resolution across chromosome 7 (top) and zoom-in views at 100-kb resolution (bottom) for a speckle hub, U1, U2, U4 and U6 snRNAs. PolII-S2P chromatin immunoprecipitation with sequencing (ChIP–seq) and nascent RNA data (10 min of 5EU) densities at 1-kb resolution. g, Schematic of direct RNA–RNA interactions by RAP-RNA43. Psoralen forms direct crosslinks between RNA–RNA hybrids, and affinity purification selectively captures U1 and its directly hybridized pre-mRNAs. h, U1 density over each 5’ splice site within a pre-mRNA measured by RAP-RNA and binned within 100-kb ChIP–seq genomic bins corresponding to speckle-close and speckle-far regions. Illustrations in a, d and g created by Inna-Marie Strazhnik, Caltech.
