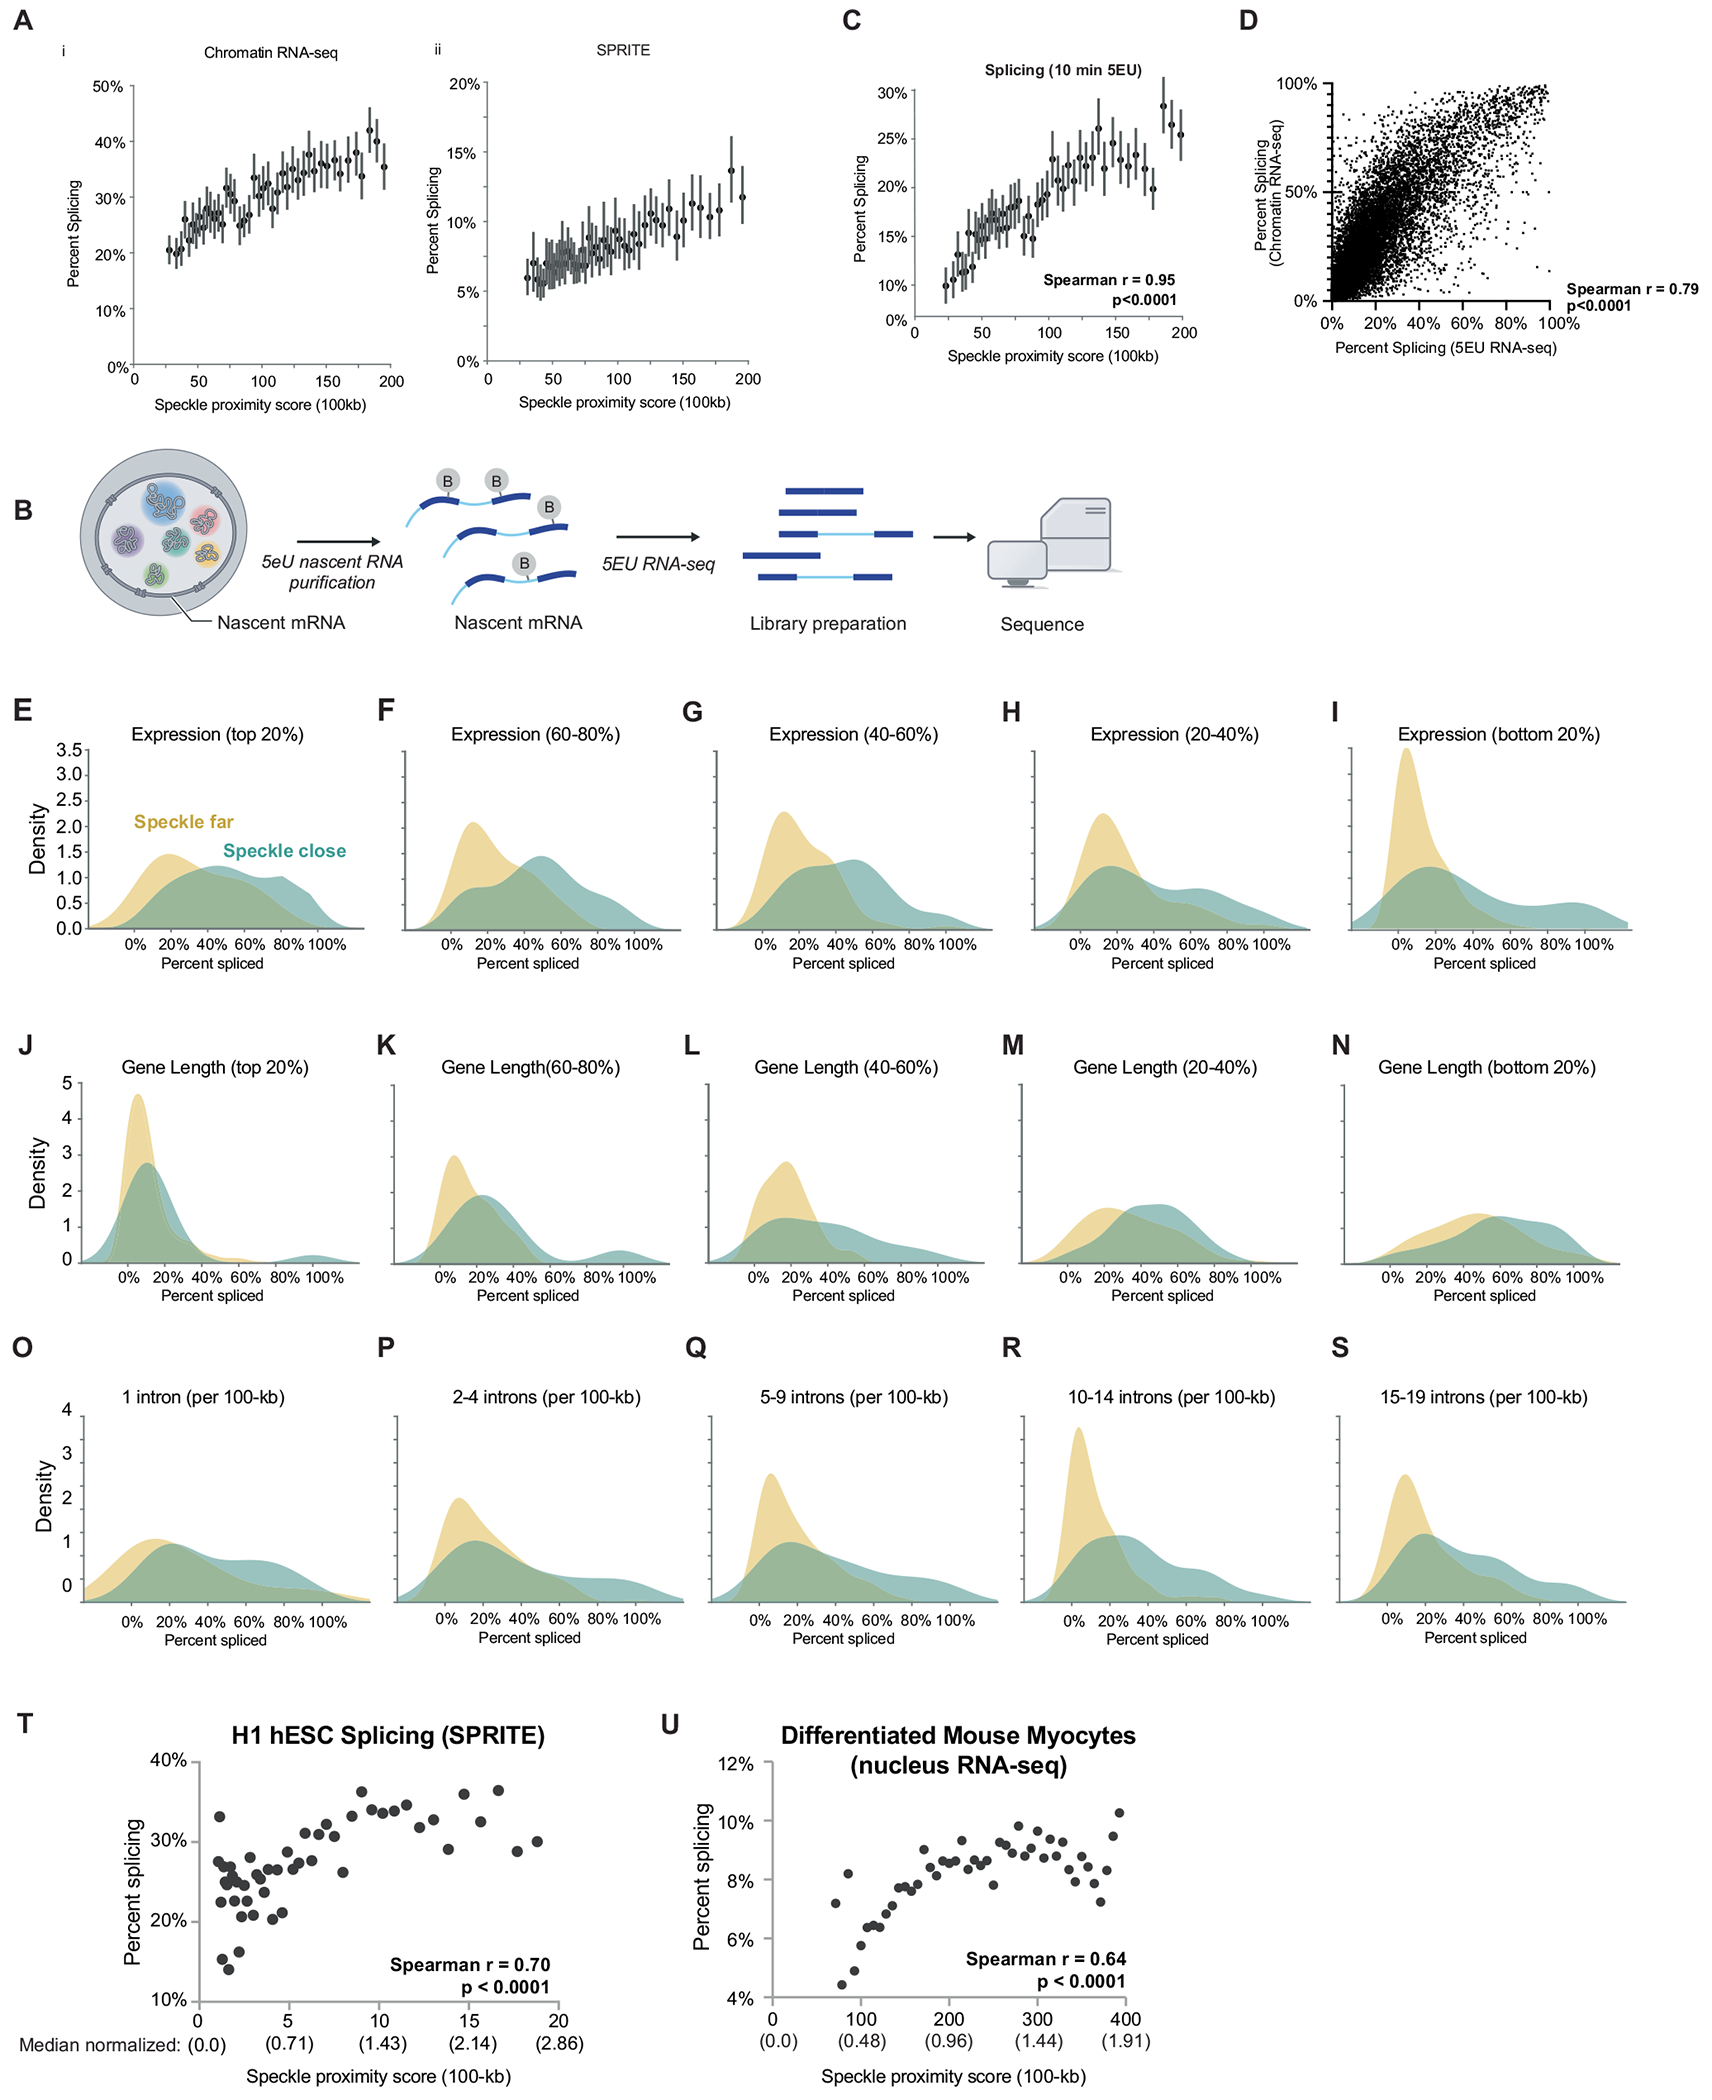
Extended Data Fig. 4 |. Higher splicing efficiency in speckle close regions across measurements, cell-types, and when comparing to genes of similar expression, length, and junction density to speckle far regions.

A. i. SPRITE speckle proximity score at 100-kb resolution (x axis) in mESCs and per cent spliced (from chromatin RNA-seq). 50 bins across all contact frequencies were taken and bins with speckle proximity scores between 0 and 200 are shown. Data are presented as mean values and bars represent 95% confidence interval. ii. SPRITE speckle proximity score at 100-kb resolution (x axis) in mESCs and per cent spliced (from SPRITE). 50 bins across all contact frequencies were taken and bins with speckle proximity scores between 0 and 200 are shown. Data are presented as mean values and bars represent 95% confidence interval. B. Schematic of 5EU labeling and nascent RNA sequencing pipeline. C. SPRITE speckle proximity score at 100-kb resolution (x axis) in mESCs and per cent spliced (from 5EU RNA-seq). 50 bins across all contact frequencies were taken and bins with speckle proximity scores between 0 and 200 are shown. Bars represent 95% confidence interval. Spearman r correlation = 0.95, p < 0.0001, P value is two-tailed. D. Correlation of splicing efficiency between previously published chromatin RNA-seq and newly generated 5EU RNA-seq (this paper; Spearman r correlation = 0.79, p < 0.0001), P value is two-tailed. (E-S) Splicing efficiency for speckle close and speckle far regions normalized for with genes that are: E. The top expressed genes (within 80–100% of expressed genes). 96 speckle close and 15 speckle far genes analzyed. F. Within 60–80% of expressed genes. 95 speckle close and 53 speckle far genes analyzed. G. Within 40–60% of expressed genes. 74 speckle close and 62 speckle far genes analyzed. H. Within 20–40% of expressed genes. 78 speckle close and 90 speckle far genes analyzed. I. The least expressed genes (0–20% of expressed genes). 51 speckle close and 173 speckle far genes analyzed. J. The longest genes (80–100% of genes lengths). 30 speckle close and 143 speckle far genes analyzed. K. 60–80% of gene lengths. 57 speckle close and 86 speckle far genes analyzed. L. 40–60% of gene lengths. 59 speckle close and 72 speckle far genes analyzed. M. 20–40% of gene lengths. 101 speckle close and 56 speckle far genes analyzed. N. The shortest genes (0–20% of gene lengths). 147 speckle close and 36 speckle far genes analyzed. O. 2 exons (single intron) per 100-kb region. 15 speckle close and 13 speckle far genes analyzed. P. 3–5 exons per 100-kb region. 50 speckle close and 119 speckle far genes analyzed. Q. 6–10 exons per 100-kb region. 51 speckle close and 202 speckle far genes analyzed. R. 11–15 exons per 100-kb region. 74 speckle close and 153 speckle far genes analyzed. S. 16–20 exons per 100-kb region. 95 speckle close and 78 speckle far genes analyzed. T. SPRITE speckle proximity score at 100-kb resolution (x axis) in H1-hESCs and per cent spliced within genomic bins from SPRITE (y axis) across 50 bins. Spearman r correlation = 0.70, p < 0.0001, P value is two-tailed. Median normalized speckle proximity scores are reported under each raw speckle hub contact value. Median value for H1 hESC = 7.0. U. SPRITE speckle proximity score at 100-kb resolution (x axis) in myocytes and per cent spliced (from nuclear RNA-seq) across 50 bins. Pearson r correlation = 0.64, p < 0.0001, P value is two-tailed. RD SPRITE data was not collected in myocytes for technical reasons. Median normalized speckle proximity scores are reported under each raw speckle hub contact value. Median value for mouse myocytes = 209. The range of speckle proximity scores vary between H1 hESC (1–20) and mouse myocytes (~75–400) due to the myocyte SPRITE data being sequenced more deeply.
