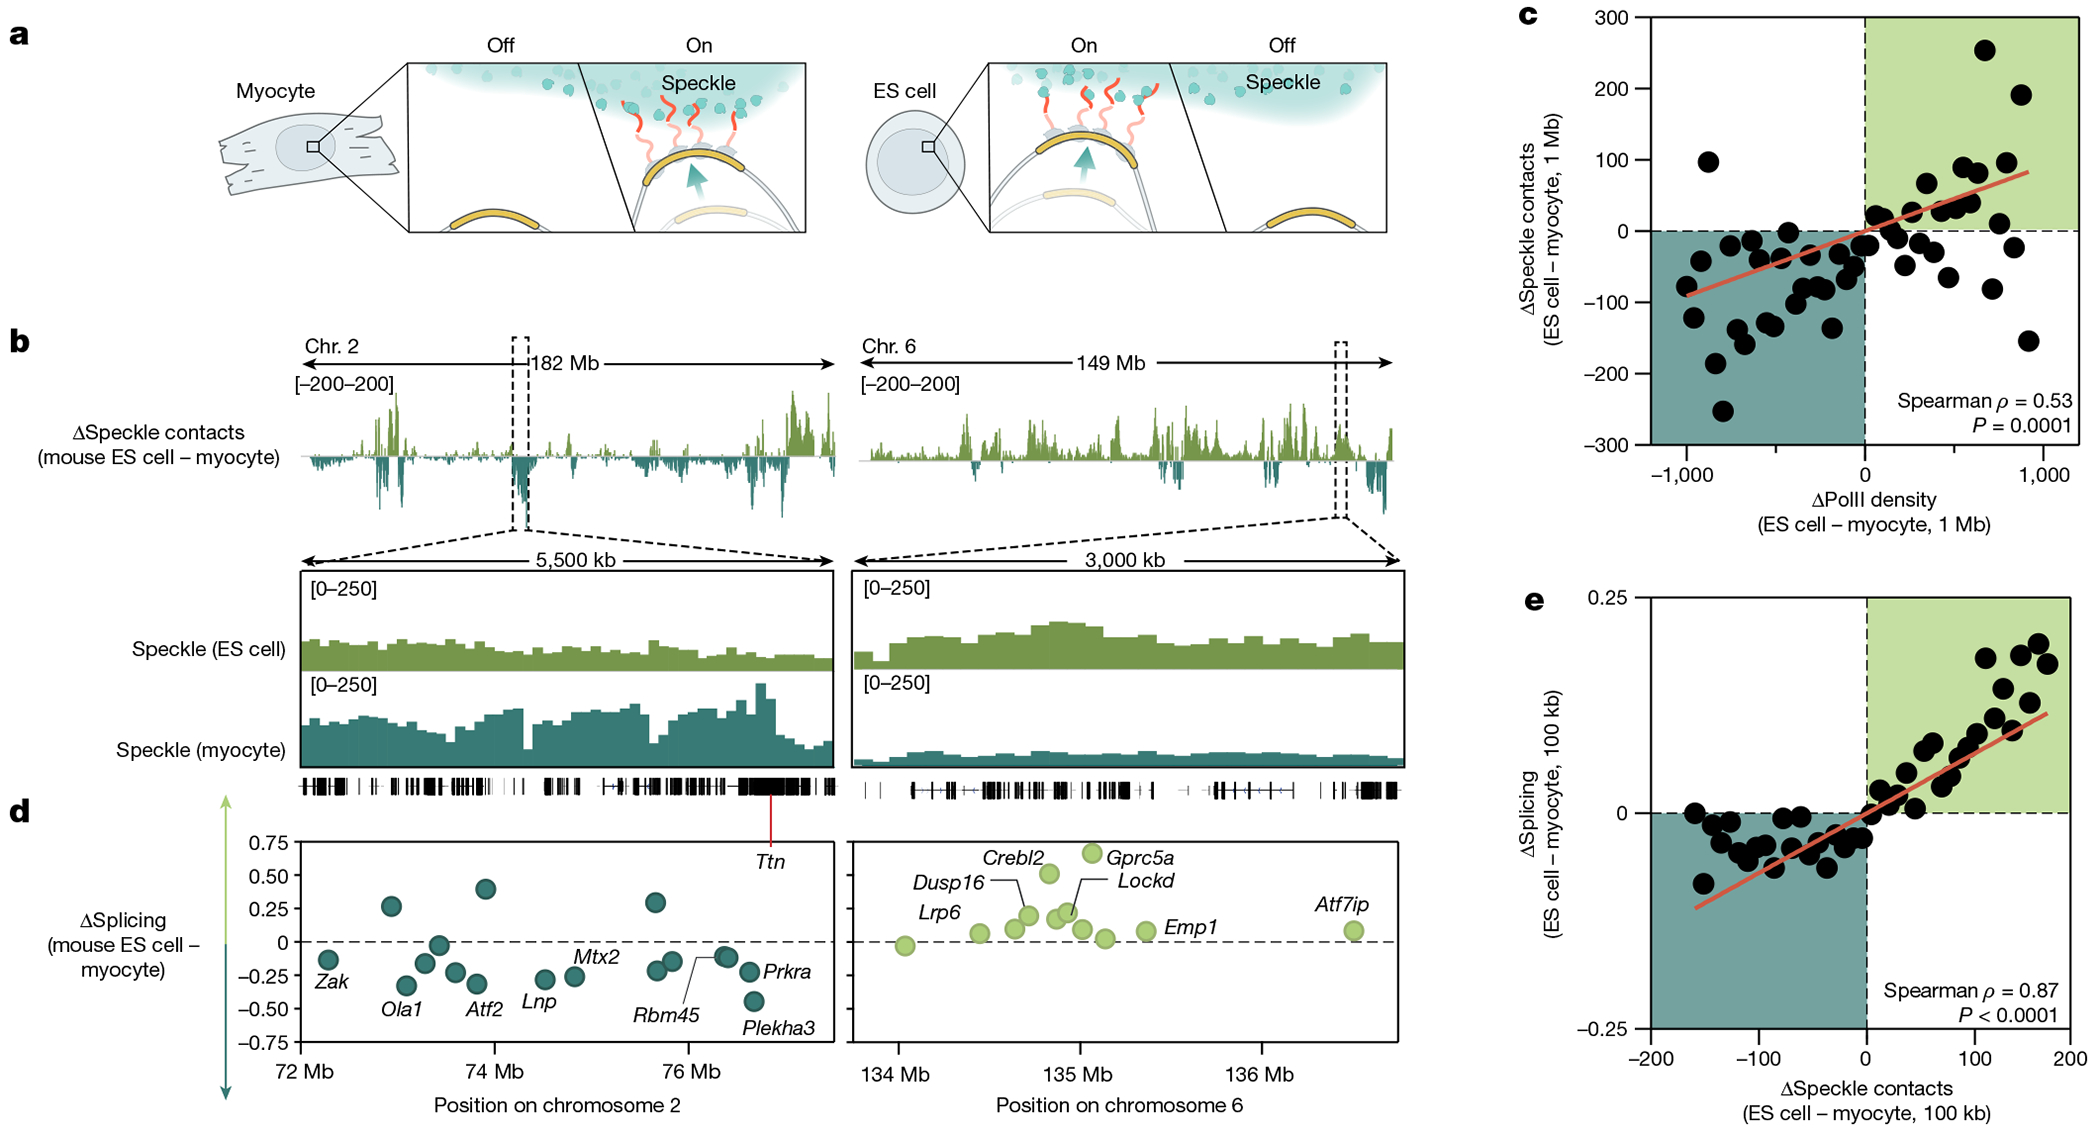
Fig. 4 |. Differential gene positioning around speckles leads to different splicing efficiencies across cell types.

a, Schematic of the differential localization of genomic DNA relative to nuclear speckles and its dependence on PolII activity. b, Top, difference in speckle proximity score between mouse ES cells and myocytes for chromosomes 2 and 6. Bottom, 5.5-Mb and 3-Mb zoom-in regions of speckle proximity scores around the Ttn (myocyte preference) and Crebl2 (mouse ES cell preference) loci, respectively. c, Difference in PolII-S2P density (x axis) versus difference in SPRITE speckle proximity score (y axis) between ES cells and myocytes at 1-Mb resolution. n = 48 bins each containing at least 10 regions. d, Difference in splicing between mouse ES cells and myocytes for genomic regions expressed in both cell types for the same zoom-in regions as in c. Individual genes are labelled. To calculate the change in splicing efficiency between cell types, we only included genes expressed in both cell types. e, Difference in speckle proximity score (x axis) versus difference in splicing (y axis) between ES cells and myocytes at 100-kb resolution. n = 41 bins each containing at least 20 regions. P value is two-tailed (c,e). Illustration in a created by Inna-Marie Strazhnik, Caltech.
