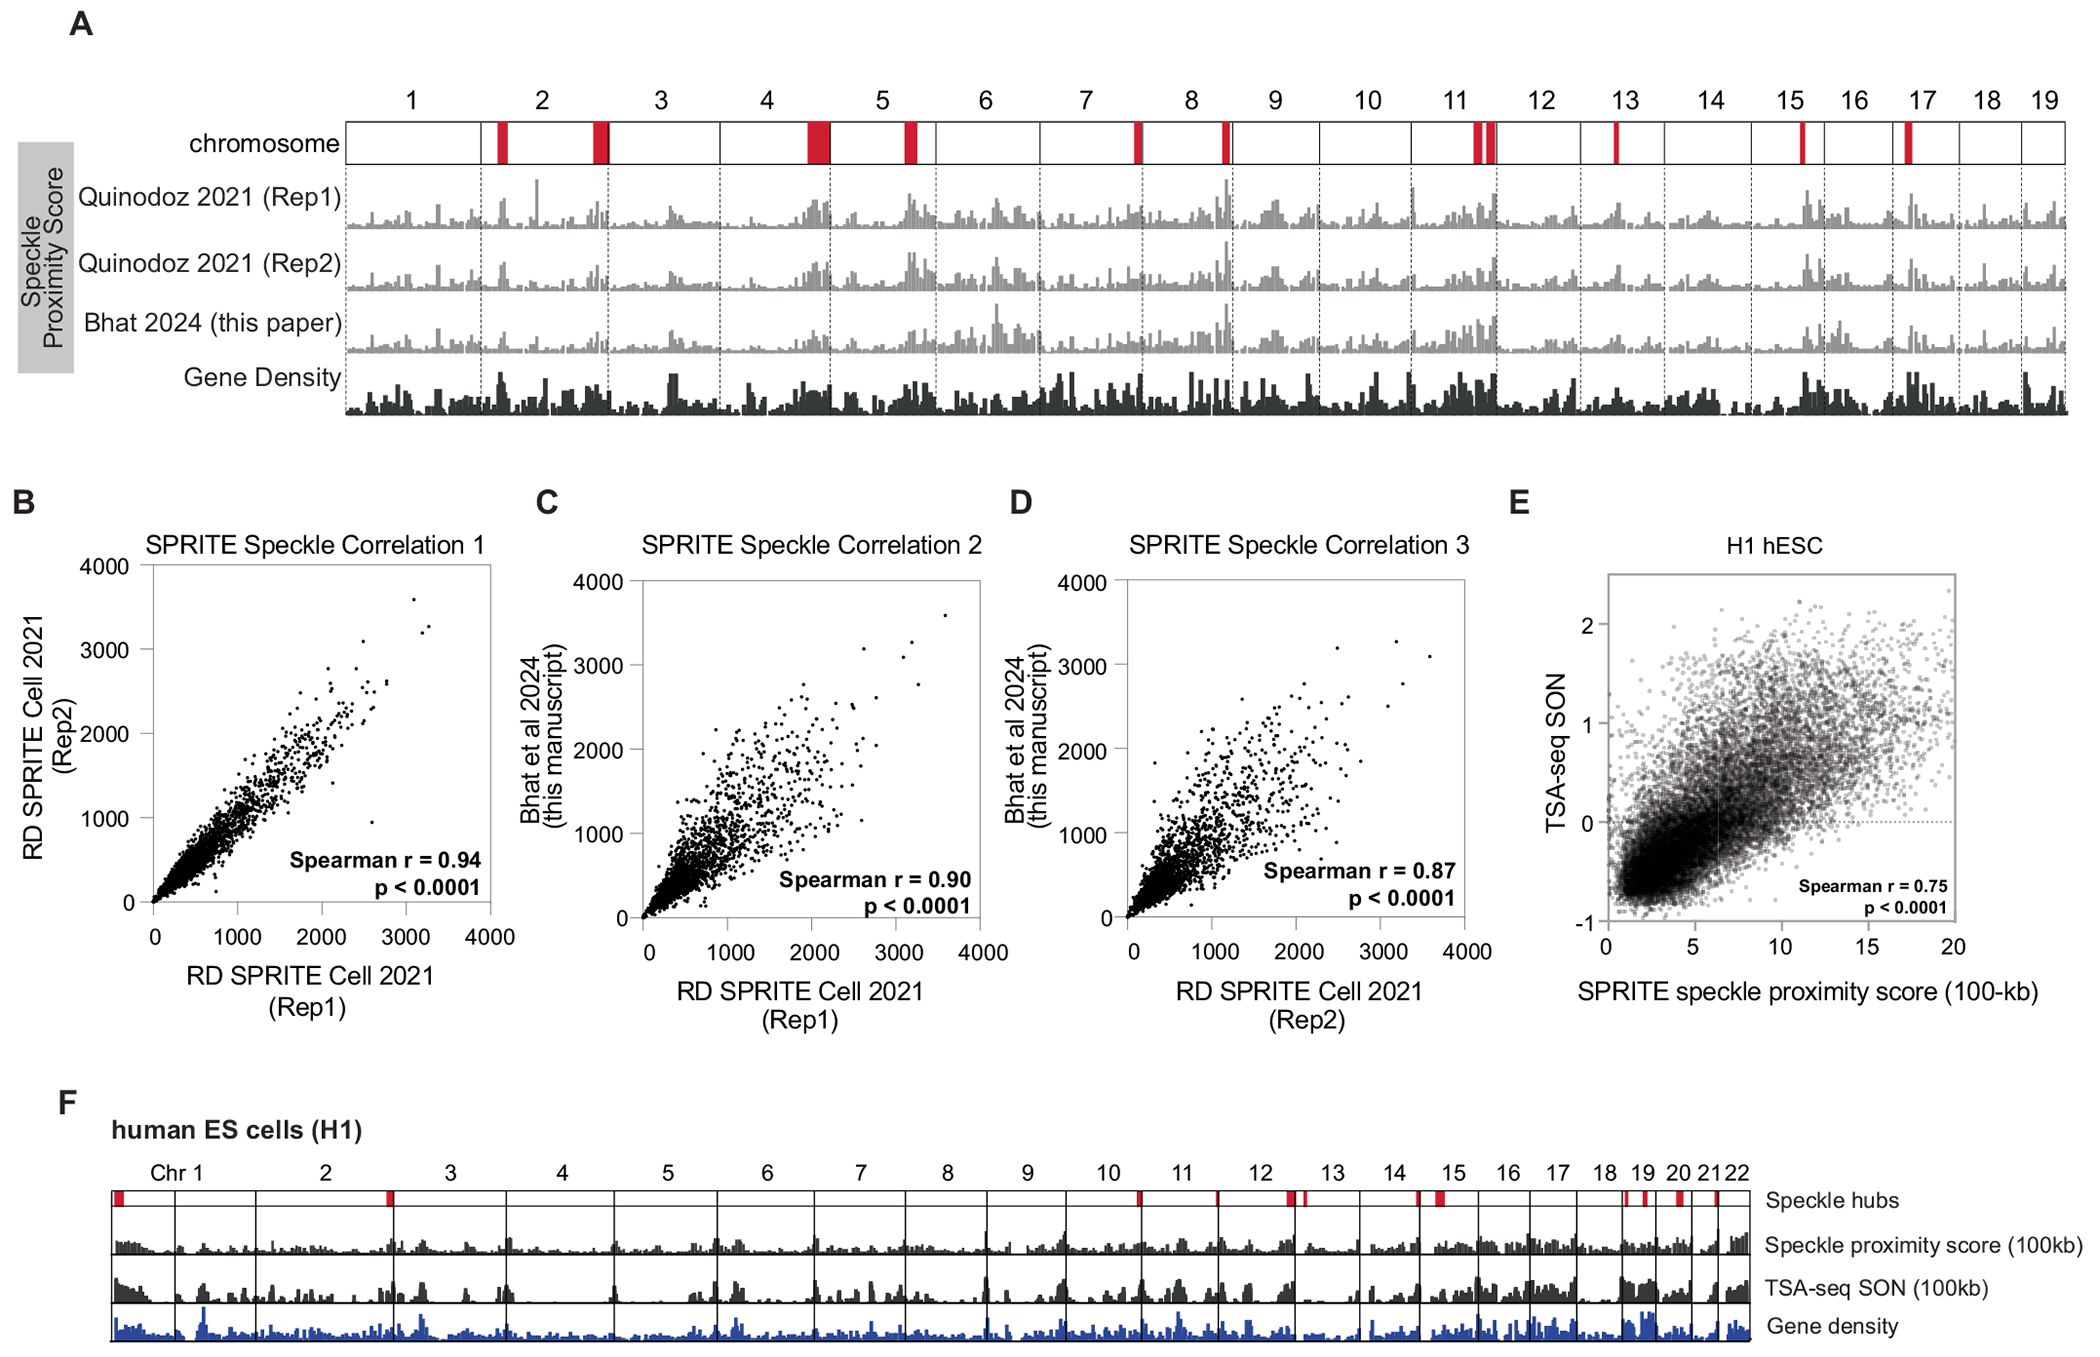
Extended Data Fig. 1 |. Correlation between speckle proximity scores between SPRITE datasets and TSA-seq for SON.

A. Chromosome wide view of speckle proximity score at 1 Mb-resolution for three replicates of SPRITE datasets in mouse ES cells. Two collected in Quinodoz et al Cell 2021 and a third dataset collected for this manuscript. Speckle hub regions highlighted on chromosomes in red. Gene density track on bottom. Correlation of SPRITE experiments between: B. RD SPRITE Cell 2021 (Replicate 1) and RD SPRITE Cell 2021 (Replicate 2) (spearman r = 0.94, p < 0.0001, P value is two-tailed). C. RD SPRITE Cell 2021 (Replicate 1) and Bhat et al 2024 (spearman r = 0.90, p < 0.0001, P value is two-tailed). D. RD SPRITE Cell 2021 (Replicate 2) and Bhat et al 2024 (spearman r = 0.87, p < 0.0001, P value is two-tailed). E. Correlation of SPRITE and TSA-seq for speckle protein, SON, in H1 hESCs (spearman r = 0.75, p < 0.0001, P value is two-tailed). F. Chromosome wide view of speckle proximity score (top track) and TSA-seq (middle track, values > 0 shown) at 100-kb resolution for H1 hESCs. Gene density shown on bottom.
