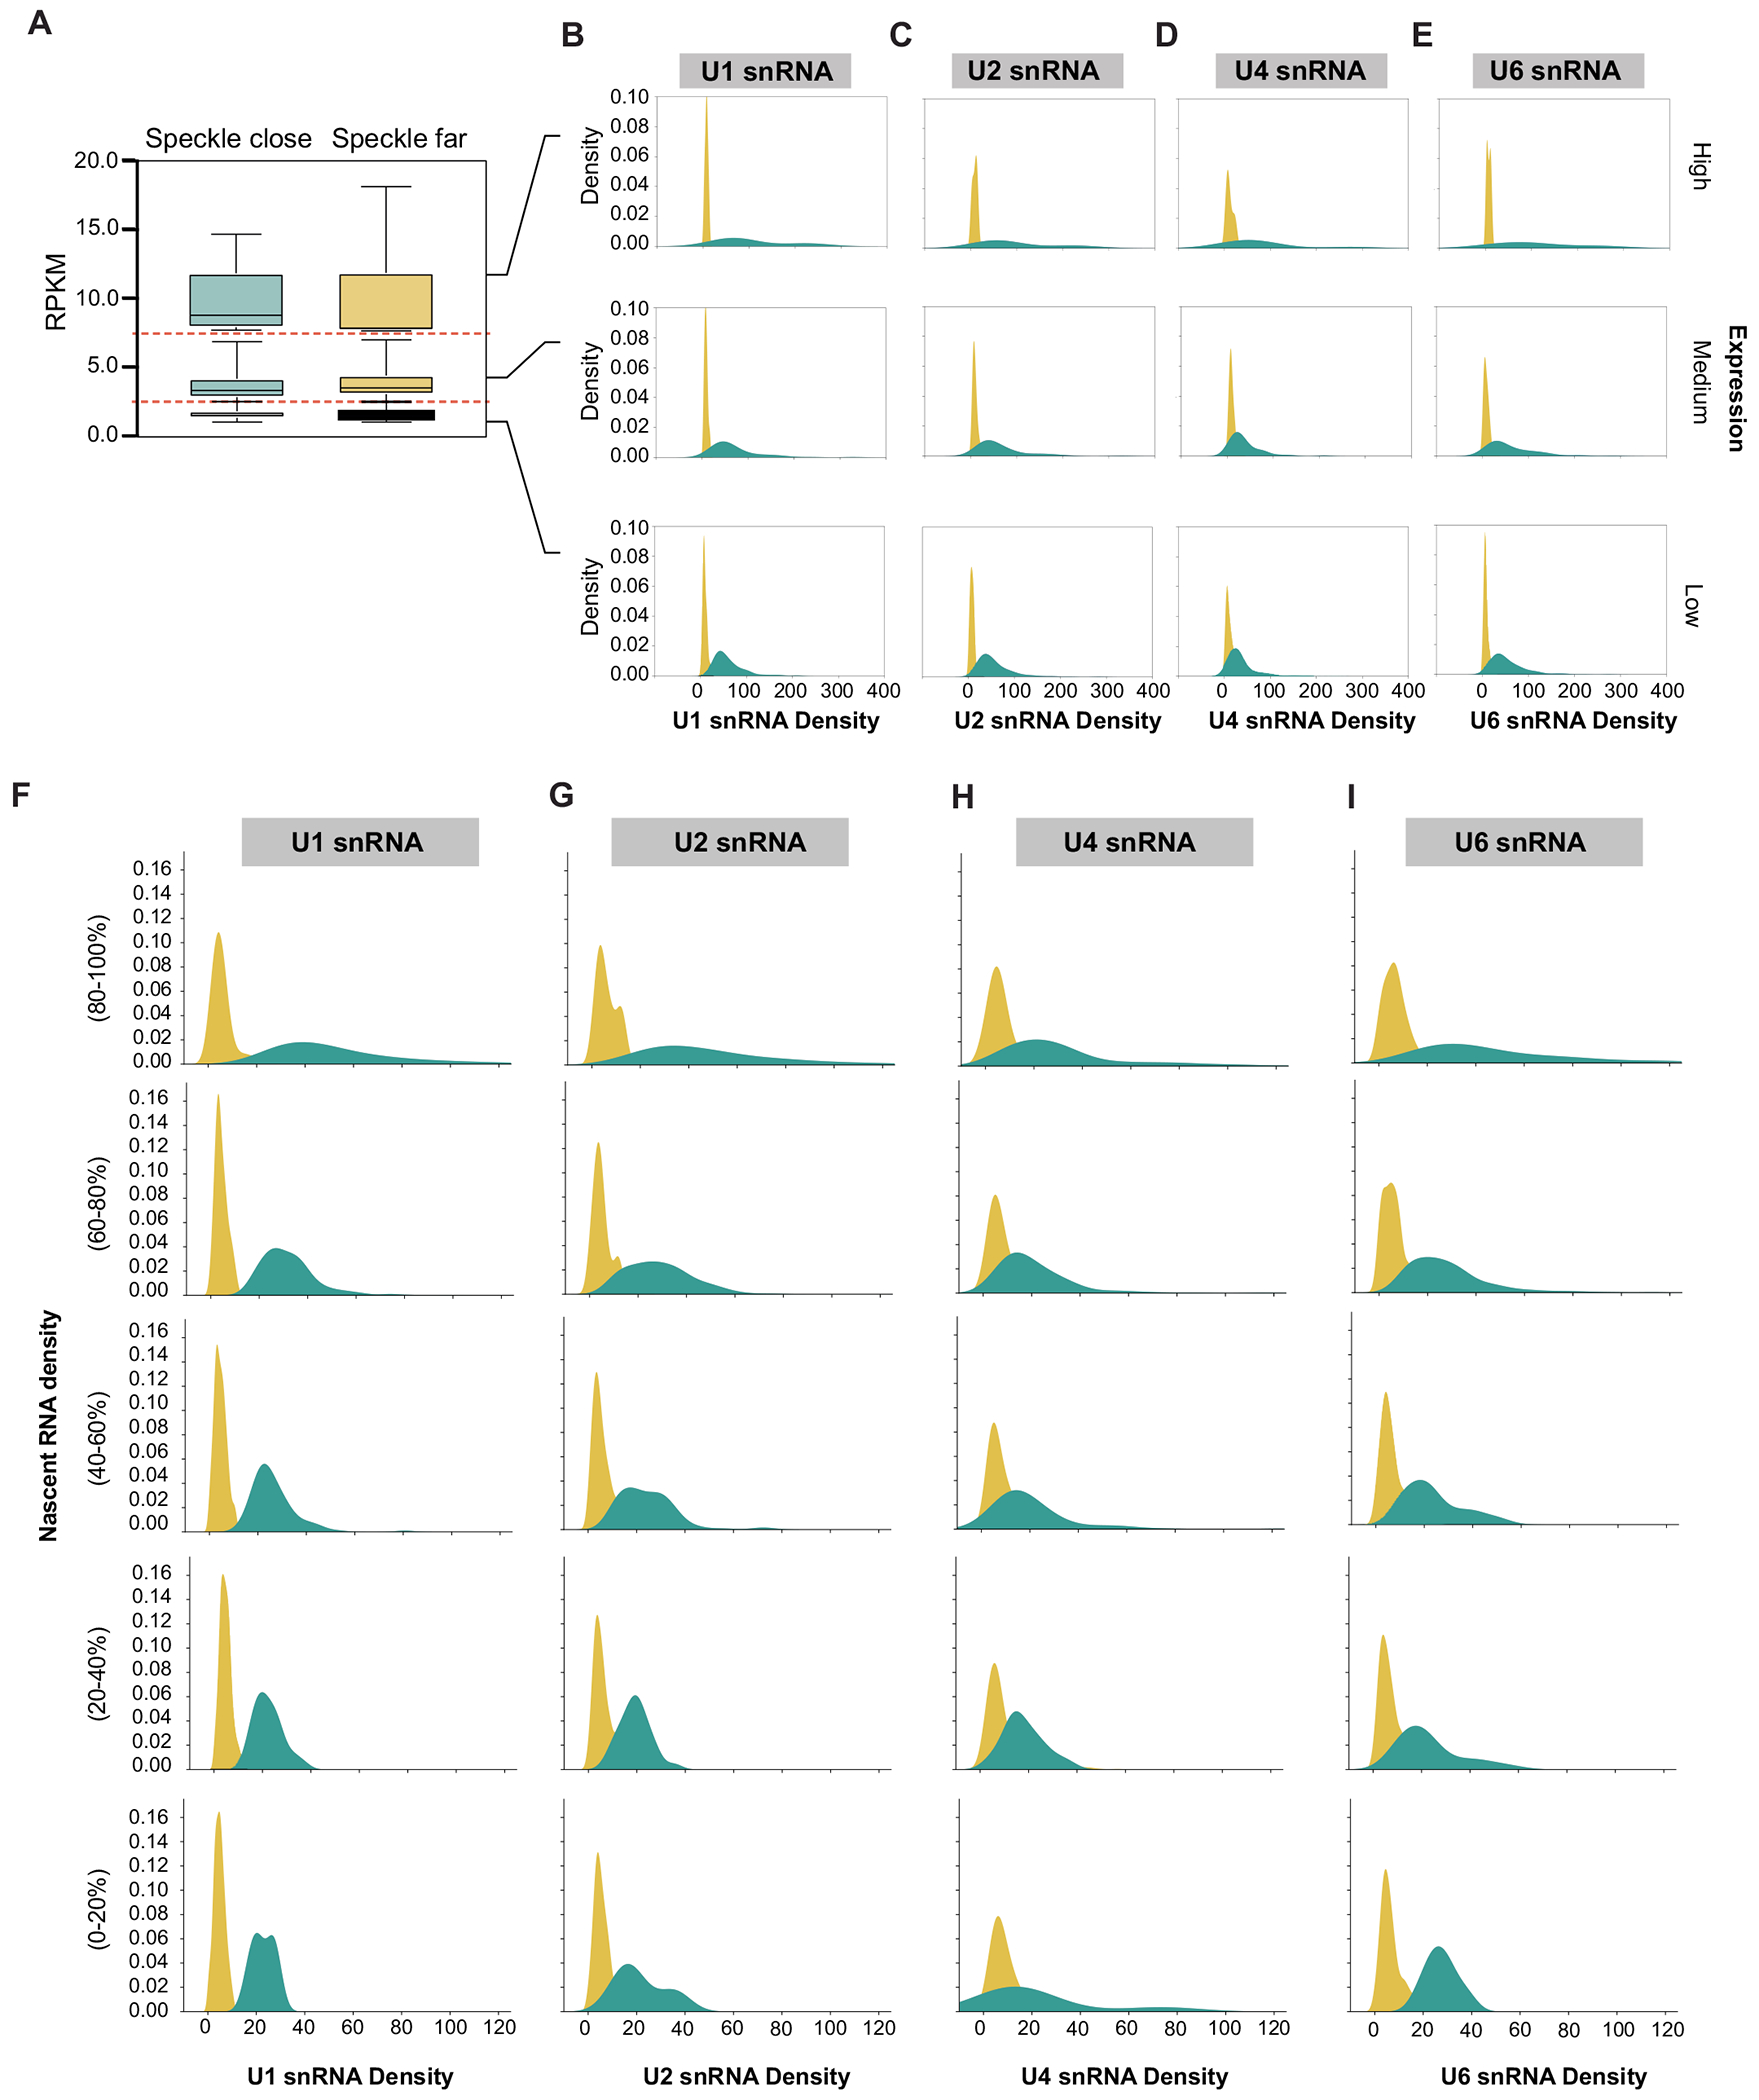
Extended Data Fig. 2 |. snRNA density for differently expressed genomic regions and different nascent transcription density.

A. To ensure that splicing factor difference were not due to expression differences between speckle close and speckle far genes, we divided genes up based on expression ranges: high expression (RPKM = 7.5-20), medium expression (RPKM = 2.5-7.5), low expression (RPKM = 1-2.5). The distribution of expression within these ranges were the same for speckle close and speckle far genes. The number of 100-kb regions analyzed are 8 regions each for high expression speckle close and far, 70 regions for medium expression speckle close and 28 for medium expression speckle far, and 194 for low expression speckle close and 62 for low expression speckle far. In the box plot, the center line represents the median, boxes show the interquartile range, whiskers show the range of values. B. U1 snRNA density is plotted for high (top), medium (middle), and low expression genes (bottom). C. U2 snRNA density is plotted for high (top), medium (middle), and low expression genes (bottom). D. U4 snRNA density is plotted for high (top), medium (middle), and low expression genes (bottom). E. U6 snRNA density is plotted for high (top), medium (middle), and low expression genes (bottom). (F-I): To ensure that splicing factor difference were not due to density of nascent transcription differences between speckle close and speckle far genes, we divided genes up based on transcription density ranges based on the number of nascent RNA reads from 5EU spanning each 100-kb bin. The number of 100-kb regions analyzed are 693 top 20% speckle close and 25 top 20% speckle far, 282 of 60–80% speckle close and 68 of 60–80% speckle far, 101 of 40–60% speckle close and 228 of 40–60% speckle far, 29 of 20–40% speckle close and 428 of 20–40% speckle far, and 7 of bottom 20% speckle close and 362 of bottom 20% speckle far. F. U1 snRNA density is plotted for top 20%, 60–80%, 40–60%, 20–40%, and bottom 20% of nascent transcription density. G. U2 snRNA density is plotted for top 20%, 60–80%, 40–60%, 20–40%, and bottom 20% of nascent transcription density. H. U4 snRNA density is plotted for top 20%, 60–80%, 40–60%, 20–40%, and bottom 20% of nascent transcription density. I. U6 snRNA density is plotted for top 20%, 60–80%, 40–60%, 20–40%, and bottom 20% of nascent transcription density.
