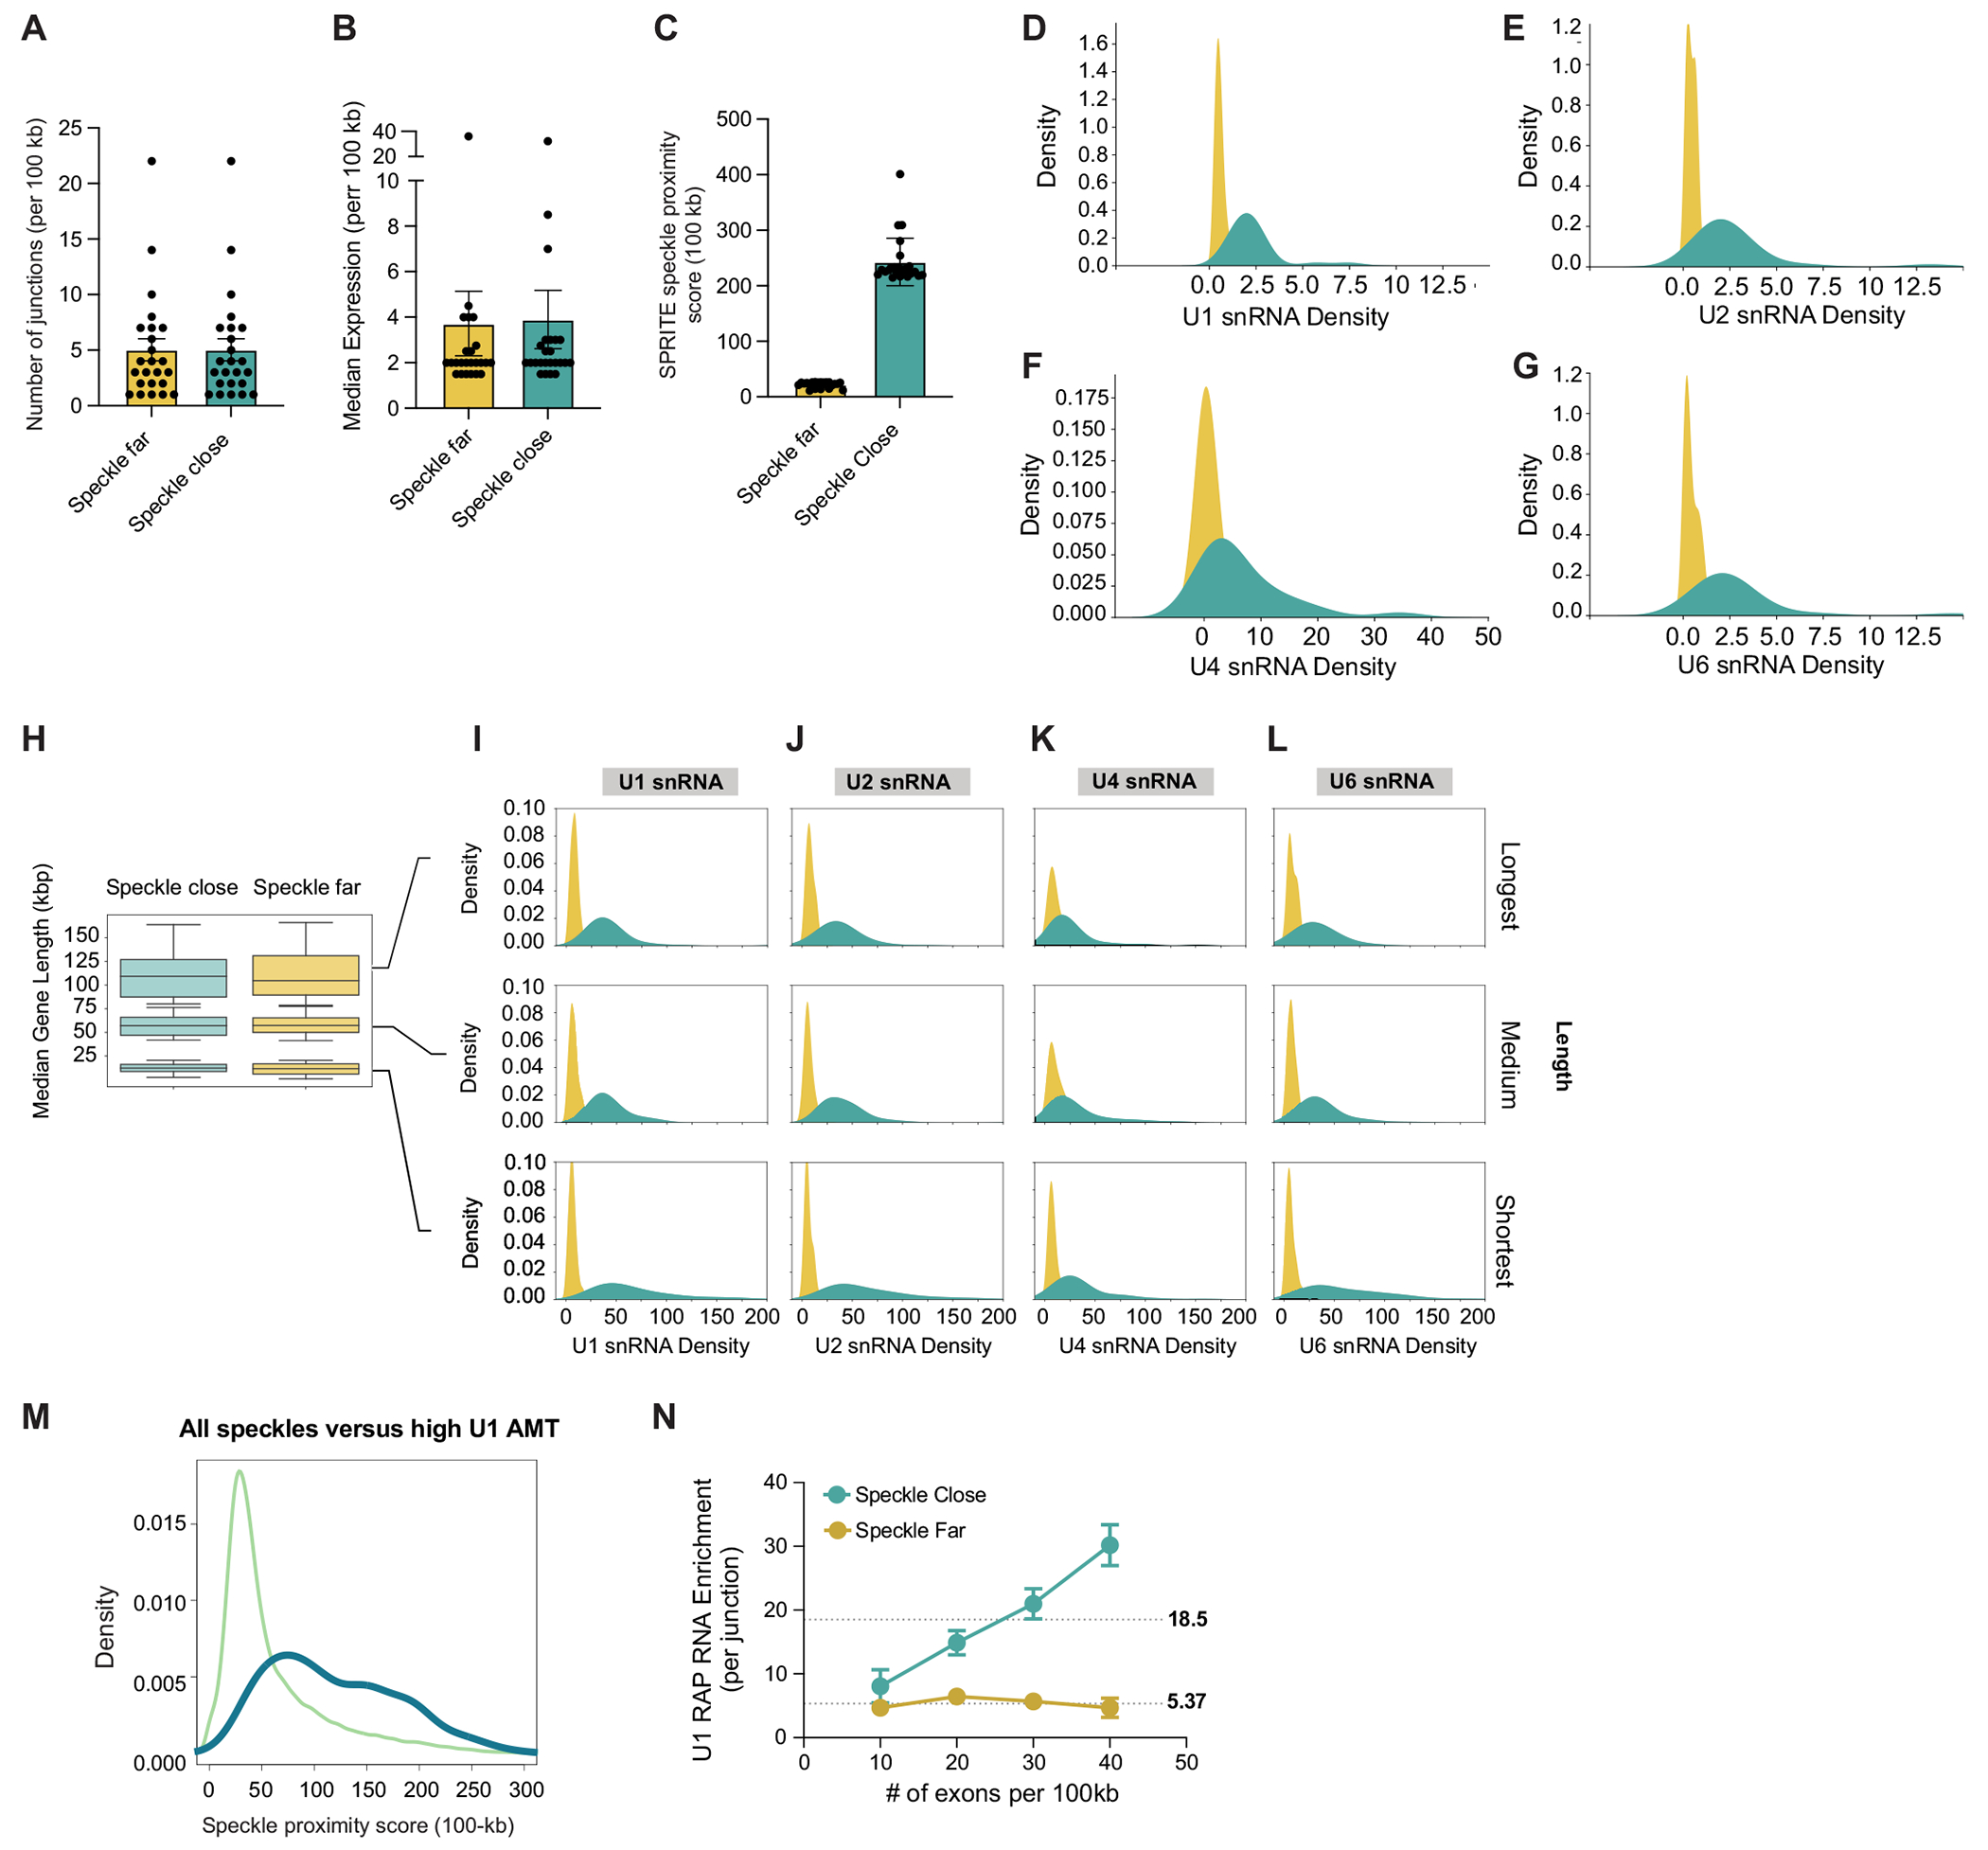
Extended Data Fig. 3 |. snRNA density for junction matched genomic regions, genomic regions harboring genes of different lengths, and U1 AMT RAP-RNA enrichment for junction matched genomic regions.

A. An identical number of regions with an identical number of junctions (179 regions each for speckle close and speckle far regions)were randomly sampled to compare regions with equivalent junction density (See Methods). B. The expression levels were matched to compare the regions in A with similar mean expression per 100-kb bin. C. SPRITE speckle proximity score of filtered speckle close and speckle far regions analyzed in panel A. D. U1 snRNA density is plotted for junction and expression-controlled regions. E. U2 snRNA density is plotted for junction and expression-controlled regions. F. U4 snRNA density is plotted for junction and expression-controlled regions. G. U6 snRNA density is plotted for junction and expression-controlled regions. H. To ensure that splicing factor difference were not due to gene length differences between speckle close and speckle far genes, we divided genes up based on gene length ranges: longest genes (60th to 80th percentile), medium length range genes (40th to 60th percentile), shortest genes (bottom 20%). The distribution of length within these ranges were the same for speckle close and speckle far genes. For the regions with the longest genes, 53 speckle close and 84 speckle far 100-kb regions analyzes. For the regions with the medium length genes, 73 speckle close and 63 speckle far 100-kb regions analyzed. For the regions with the shortest genes, 178 speckle close and 102 speckle far 100-kb regions analyzed. In the box plot, the center line represents the median, boxes show the interquartile range, whiskers show the range of values. I. U1 snRNA density is plotted for longest (top), medium (middle), and shortest length genes (bottom). J. U2 snRNA density is plotted for longest (top), medium (middle), and shortest length genes (bottom). K. U4 snRNA density is plotted for longest (top), medium (middle), and shortest length genes (bottom). L. U6 snRNA density is plotted for longest (top), medium (middle), and shorted length genes (bottom). M. Density plot showing speckle proximity score (100-kb) for genomic regions enriched for U1 binding. N. U1 RAP RNA enrichment per junction (y-axis) versus number of exons per 100-kb genomic bin for speckle close and speckle far regions. Dotted lines are mean U1 enrichment values and error is SEM. Number of regions per point: n = 97, 91, 28, and 12 for speckle far regions exon number = 10, 20, 30 and 40, respectively; n = 18, 68, 70, and 47 for speckle close regions exon number = 10, 20, 30 and 40, respectively.
