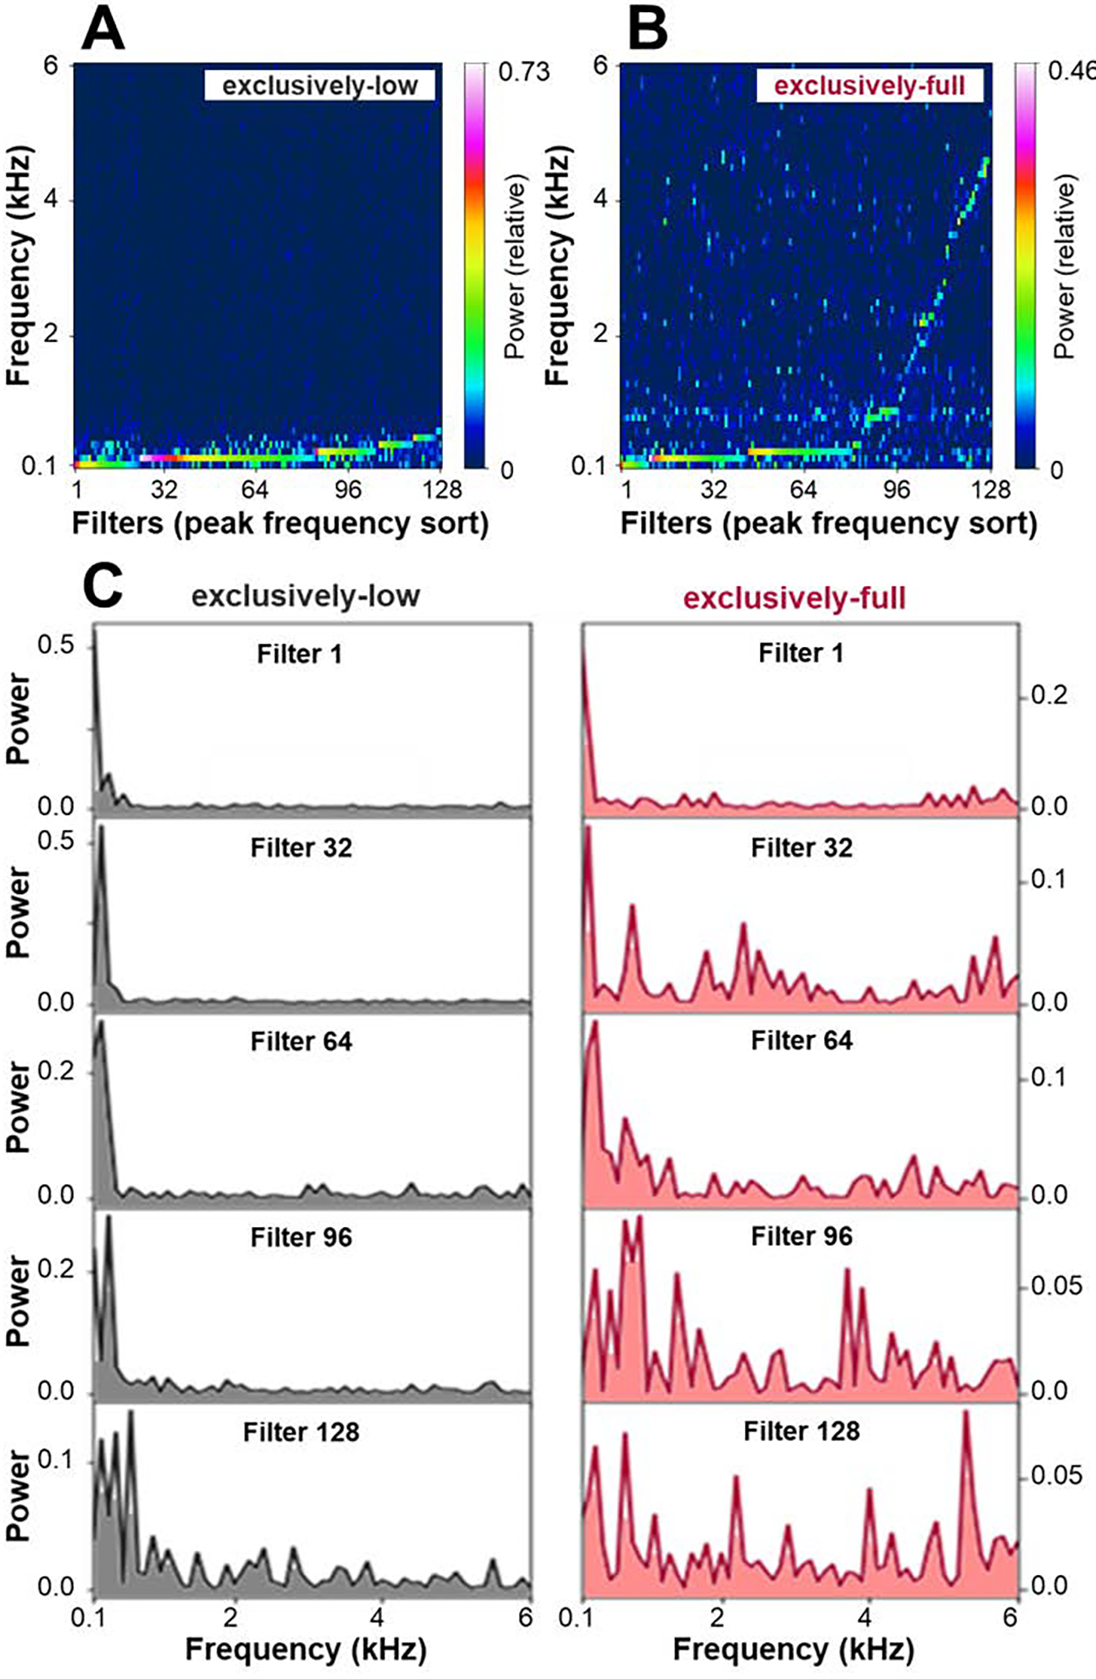
Figure 2.

Receptive field analysis. A&B. Spectral distribution of first-layer filters in the network trained on full-frequency (A) and low-frequency input (B). Colors code for normalized power obtained through frequency decomposition, with the sum of values up to 6 kHz normalized to 1. C. Close-up of spectral profiles of individual filters (filters with the 1st, 32nd, 64th, 96th, and 128th lowest peak frequency), when training followed exclusively-full and exclusively-low frequency regimens, respectively.
