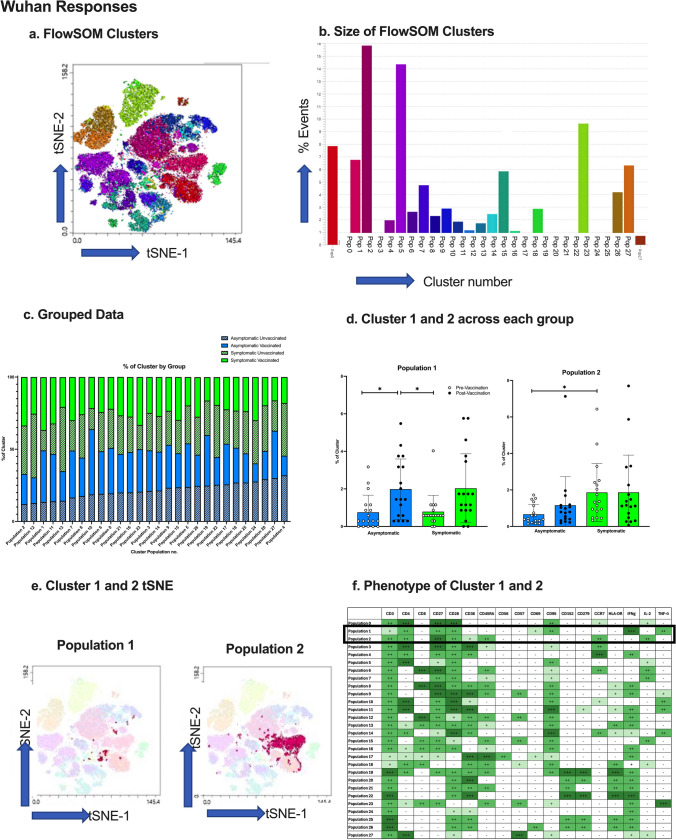
Fig. 5.
Wuhan-stimulated T cell Clustering Analysis. (a) FlowSOM clusters from Wuhan spike-exposed T cells presented as a tSNE plot. (b) The number of events in each FlowSOM cluster. (c) % of cluster occupied by negative, asymptomatic, and symptomatic subject groups before and after vaccination. (d) Statistical analysis of the differences between clusters 1 and 2, between groups. (e) tSNE plots of cluster 1 and 2 to identify location and size of cluster. (f) T cell marker expression of clusters 1 and 2. *=p<0.05, **=p<0.01, N=19. Light blue bars = negative participants, dark blue bars = asymptomatic participants, green bars = symptomatic participants

