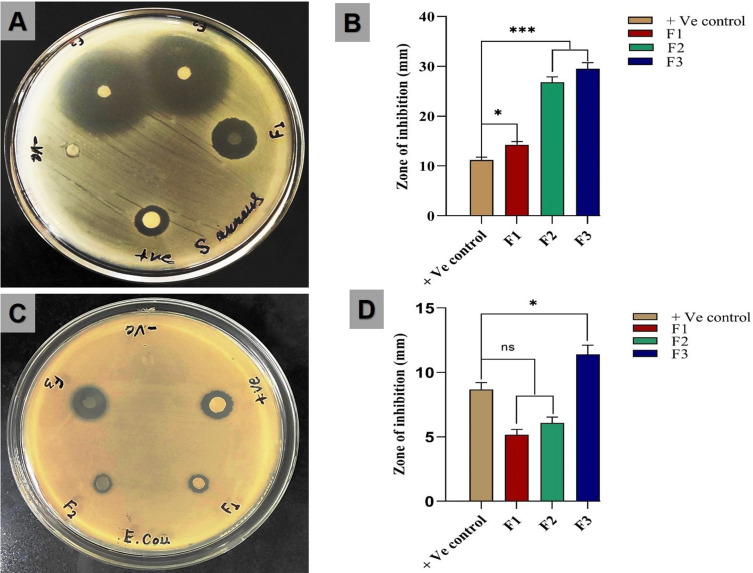
Figure 4.
Plate representing the zone of inhibition against (A) S. aureus and (B) E.Coli of positive control, negative control, F1 (PVP-RSV), F2 (PVA-AMP) and F3 (PVP-PVA-RSV-AMP). (C and D) shows the bar graph of A and B, respectively. *p <0.05, ***p <0.001, one-way ANOVA followed by Bonferroni multiple comparison test. ns denotes non-significant difference between groups. All the data represented as mean±SD (n=3).

