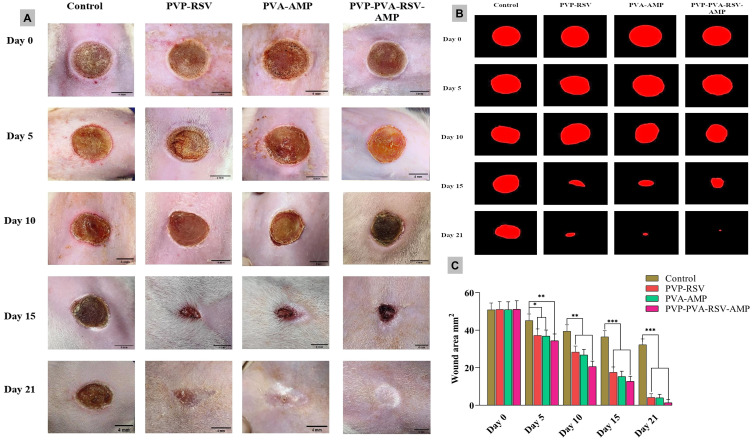
Figure 10.
(A) Photographic images representing the burn wound healing of all the groups (Control, PVP-RSV, PVA-AMP, and PVP-PVA-RSV-AMP nanofiber-treated groups) on days 0, 5, 10, 15, and 21, (B) Representing the traces of wound area calculated by ImageJ software on different days 0, 1, 5, 10, 15 and 21 and (C) Bar diagram representing the % wound area (mm2) after treating the burn wound with drug-loaded nanofibrous mats (PVP-RSV, PVA-AMP, and PVP-PVA-RSV-AMP) and control group. *p <0.05, **p<0.01, and ***p <0.001, one-way ANOVA followed by Bonferroni multiple comparison test. All the data represented as mean±SD (n=3).

