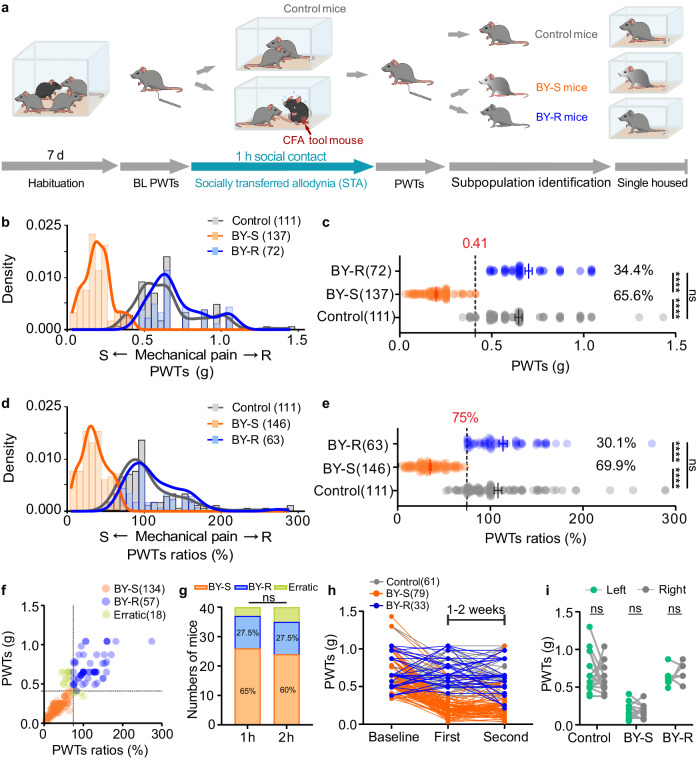
Fig. 1. Identification of susceptible and resilient sub-populations.
a Experimental timeline. b PWTs distribution in control, susceptible and resilient mice (n = 111, 137 and 72 mice). c Horizontal scatterplot depicting the distribution of PWTs (n = 111, 137 and 72 mice). Control versus BY-S, P < 0.0001; Control versus BY-R, P = 0.4058; BY-S versus BY-R, P < 0.0001. The black dashed line represents the threshold value dividing the two subgroups. d PWTs ratios distribution in control, BY-S and BY-R mice (n = 111, 146 and 63 mice). e Horizontal scatterplot depicting the distribution of individual PWTs ratios (n = 111, 146 and 63 mice). Control versus BY-S, P < 0.0001; Control versus BY-R, P = 0.9796; BY-S versus BY-R, P < 0.0001. The black dashed line represents the threshold value dividing the two subgroups. f Scatterplot showing overlapped susceptible and resilient mice identified with the two methods (n = 134, 57 and 18 mice). g Percentages of susceptible and resilient mice after 1 h (n = 26, 11 and 3 mice; left) and 2-h social contact (n = 24, 11 and 5 mice; right). P = 0.7483. h Individual PWTs plotted across two STA repeats at a 1-week or 2-week interval (n = 61, 79 and 33 mice). i PWTs of the ipsilateral versus contralateral hind paws of the BY mice (n = 18, 13 and 6 mice). BL baseline; PWTs paw withdraw thresholds; CFA complete Freund’s adjuvant; BY-S the susceptible sub-population to socially transferred allodynia; BY-R the resilient sub-population to socially transferred allodynia; STA socially transferred allodynia. The data are presented as the mean ± s.e.m. ****P < 0.0001, ns no significance. Data analyzed by (c, e) Kruskal–Wallis test with Dunn’s multiple comparisons test; g chi-square test; or i two-way repeated-measures (RM) ANOVA with Tukey’s multiple comparisons test. Statistical details are presented in Supplementary Table 5. Source data are provided as a Source Data file.

