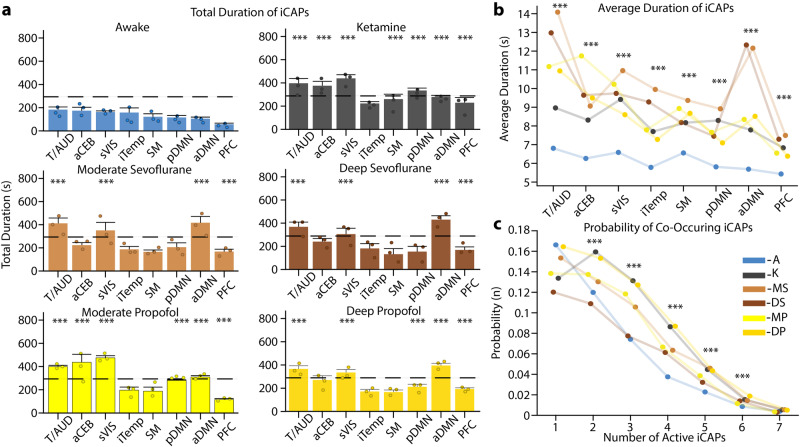
Fig. 4. Durations of iCAPs in different conditions and probability of co-occurrences.
a Total duration of the first 8 iCAPs (in seconds) for each condition in descending order represented in awake. Each condition is represented in its own plot with awake (blue), ketamine (gray), moderate sevoflurane (light brown), deep sevoflurane (dark brown), moderate propofol (light yellow), and deep propofol (dark yellow). Error bars on each bar represent SEM over each animal and the black dashed line represents 25% of total possible duration. Dots represent average values for each animal individually. b Average durations (in seconds) of iCAPs reflecting the length of continuous activity. c The probability of a different number of iCAPs to overlap is displayed for each condition. For all panels, inference on the mean differences is performed by bootstrapping, with n = 10,000 bootstrap samples; *** indicates statistical significance of p < 0.001 adjusted with Bonferroni correction.

