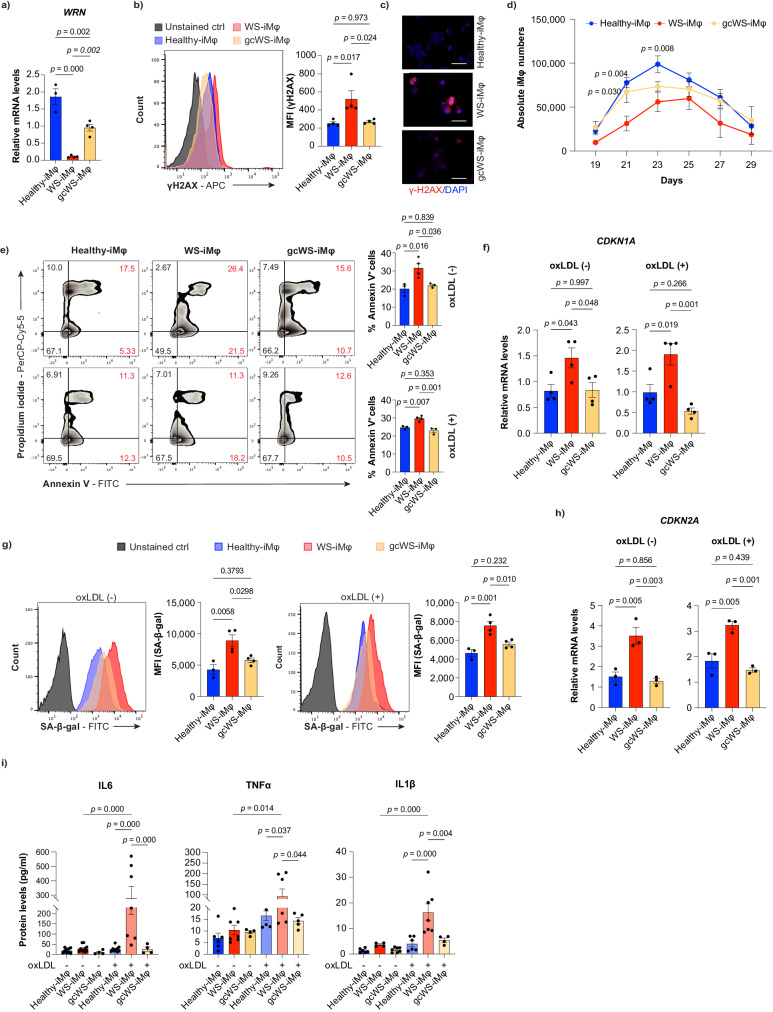
Fig. 1. Apoptosis and cellular senescence lead to impaired WS-iMφ proliferation.
a mRNA levels of WRN normalized by GAPDH mRNA (n = 4). b Representative flow cytometric histogram of γ-H2AX staining in healthy-, WS-, and gcWS-iMφs without oxLDL treatment (left) and γ-H2AX MFI (right) (n = 4). c Immunofluorescence image of γ-H2AX foci in healthy-, WS-, and gcWS-iMφs. The scale bar is 30 μm. d Absolute numbers of CD14+CD11b+ healthy- (n = 3), WS- (n = 4), and gcWS-iMφs (n = 3). e Representative flow cytometric plots of annexin V staining in healthy-, WS-, and gcWS-iMφs without (left top) or with (left bottom) oxLDL treatment. Bar graphs show the total proportion of annexin V+ cells among healthy- (n = 3), WS- (n = 4), and gcWS-iMφs (n = 3), before (right top) and after (right bottom) oxLDL treatment. f mRNA levels of CDKN1A normalized by GAPDH mRNA before (left) and after (right) oxLDL treatment (n = 4). g Representative flow cytometric plots of SA-β-gal staining before (left) and after (right) oxLDL treatment among healthy-, WS-, and gcWS-iMφs. Bar graphs show the MFI of SA-β-gal among healthy- (n = 3), WS- (n = 4), and gcWS-iMφs (n = 4), before (left) and after (right) oxLDL treatment. h mRNA levels of CDKN2A normalized by GAPDH mRNA before (left) and after (right) oxLDL treatment (n = 3). i Secreted pro-inflammatory cytokine protein levels, determined by ELISA, for healthy-, WS-, and gcWS-iMφs before (n = 9, 10, 4) and after oxLDL treatment (n = 9, 7, 4). Three independent experiments of three independent biological samples were used for Healthy- ans WS- iMφs. Data are shown as the mean ± standard error of the mean (SEM) of biologically independent samples unless otherwise stated. One-way ANOVA with Tukey’s multiple comparisons was performed to calculate the p values. MFI mean fluorescent intensity, oxLDL oxidized low-density lipoprotein. Source data are provided as a Source Data file.

