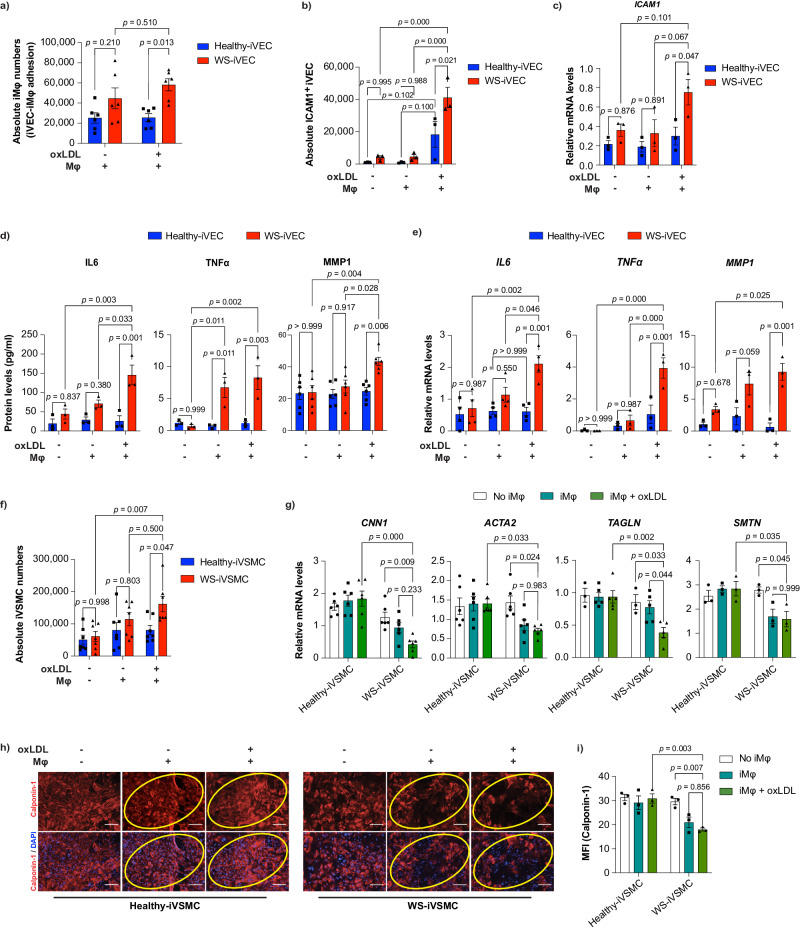
Fig. 2. Effects of inflammatory iMφs on iPSC-derived vascular cells.
a Absolute numbers of CD14+ adherent iMφs on iVECs after co-culture (n = 6). b Absolute numbers of ICAM1+ VE-cad+ iVECs before and after co-culture with untreated or oxLDL-treated Mφs (n = 3). c mRNA levels of ICAM1 normalized by GAPDH mRNA before and after co-culture with untreated or oxLDL-treated Mφs (n = 3). d IL6 (n = 3), TNFα (n = 3), and MMP1 (n = 6) protein levels quantified by ELISA before and after co-culture with untreated or oxLDL-treated Mφs. e IL6, TNFα, and MMP1 mRNA levels normalized by GAPDH mRNA before and after co-culture with untreated or oxLDL-treated Mφs (n = 3). f Absolute numbers of healthy- and WS-iVSMCs before and after co-culture with untreated or oxLDL-treated Mφs (n = 7). g mRNA levels of VSMC contractile markers (CNN1 (n = 6), ACTA2 (n = 6), TAGLN (n = 3, 5, 5), SMTN (n = 3)) normalized by GAPDH mRNA before and after co-culture with untreated or oxLDL-treated Mφs. h Immunocytochemistry of calponin-1 protein in healthy- and WS-iVSMCs before and after co-culture with untreated or oxLDL-treated Mφs. The scale bar is 100 μm. i MFI of calponin-1 protein expression from (h). ImageJ was used to calculate calponin-1 MFI (n = 3). Data are shown as the mean ± SEM. (n = 6) represents two biologically independent samples over two independent experiments, and (n = 3) represents biologically independent samples. Two-way ANOVA with Tukey’s multiple comparisons was performed to calculate the p values. MFI mean fluorescent intensity, oxLDL oxidized low-density lipoprotein. Source data are provided as a Source Data file.

