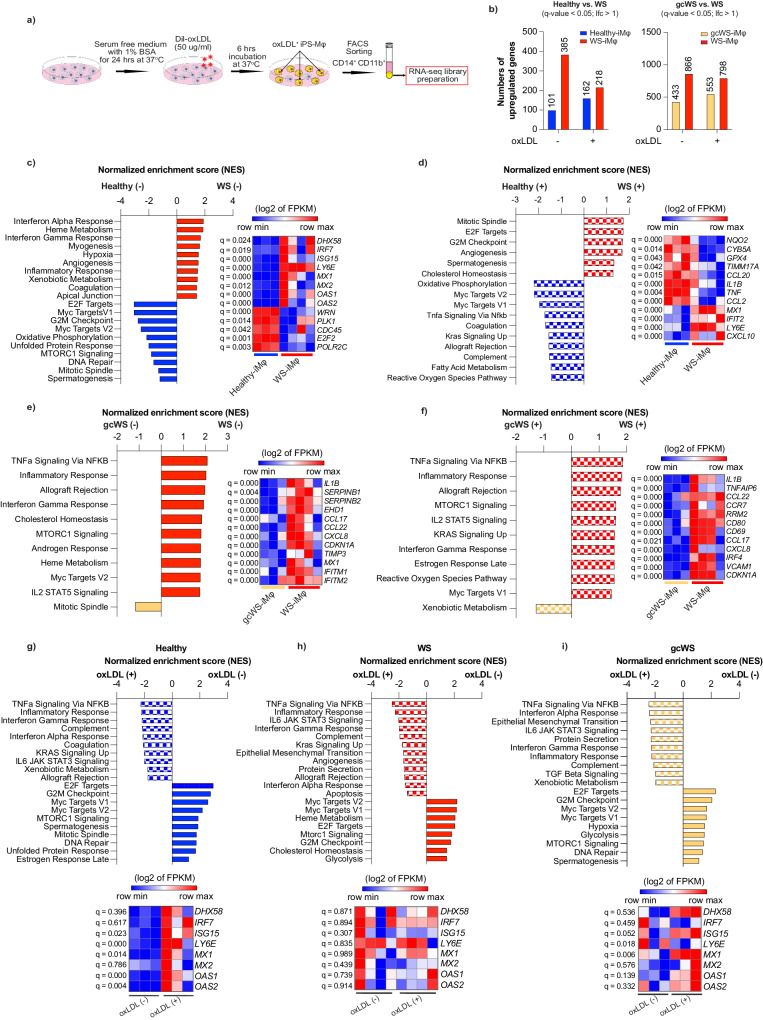
Fig. 3. RNA-seq analysis of iMφs.
a Schematic diagram of RNA-seq library preparation. b Numbers of DEGs in healthy- (blue), WS- (red), and gcWS-iMφs (yellow) before and after oxLDL treatment. DEGs were derived from Cuffdiff pairwise analysis (q-value < 0.05, lfc >1). Pairwise GSEA of non-treated healthy- vs. WS-iMφs (c), oxLDL-treated healthy- vs. WS-iMφs (d), non-treated gcWS- vs. WS-iMφs (e), oxLDL-treated gcWS- vs. WS-iMφs (f), non-treated healthy-iMφs vs. oxLDL-treated healthy-iMφs (g), non-treated WS-iMφs vs. oxLDL-treated WS-iMφs (h), and non-treated gcWS-iMφs vs. oxLDL-treated gcWS-iMφs (i). Bar plots show the top 10 enriched pathways in GSEA, and heatmaps show the enriched gene sets in those top 10 pathways. Heatmaps were derived from the log2 of fragments per kilobase of exon per million reads mapped (FPKM) values. Statistical significance was derived from q-values calculated by Cuffdiff. (–) non-treated; (+) oxLDL-treated. All the experiments in this figure were derived from (n = 3, for healthy-; n = 4 for WS-; and n = 3 for gcWS-iMφ biologically independent samples). oxLDL oxidized low-density lipoprotein.

