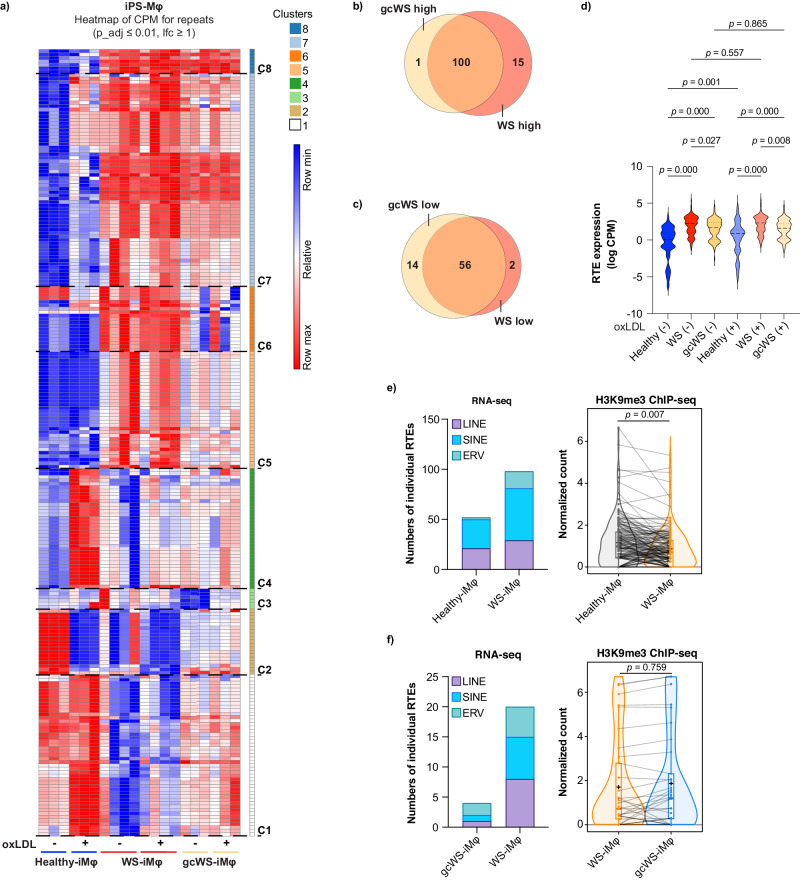
Fig. 6. Resurrection of retrotransposons in WS-iMφs.
a Heatmap showing differential expression of RTEs obtained using limma-voom in healthy- (n = 3), WS- (n = 4), and gcWS-iMφs (n = 3) before and after oxLDL treatment, with each column representing a sample group and each row representing an individual RTE. Moderated paired t tests were performed using limma, and the p values were corrected for multiple comparisons using Benjamini Hochberg’s method. Venn diagram showing commonly upregulated (b) and downregulated (c) RTEs in gcWS- (n = 3) and WS-iMφs (n = 4) compared with healthy-iMφs (n = 3) in pairwise analysis (adjusted p < 0.01, lfc >1). Pairwise analysis of individual numbers of RTEs was determined by RNA-seq with moderated paired t tests were performed using limma, and the p values were corrected for multiple comparisons using Benjamini Hochberg’s method. d Levels of RTE expression healthy- (n = 3), WS- (n = 4), and gcWS-iMφs (n = 3) (adjusted p < 0.01, lfc >1) before and after oxLDL treatment. Data are presented as logCPM values for each group. One-way ANOVA was performed to calculate the p values. e Numbers of individual RTEs (adjusted p < 0.01, lfc >1) at sub-family (LINE, SINE, and ERV) levels in non-treated healthy- and WS-iMφs (left), for which levels of H3K9me3 were determined by ChIP-seq in non-treated healthy- (n = 3) and WS-iMφs (n = 3) (right). Welch Two Sample t test was performed to calculate the p values. Boxes represent the 25–75 percentile ranges with the median of the horizontal line and the mean of the plus. The ends of vertical lines represent the 10 or 90 percentiles. f Numbers of individual RTEs (adjusted p < 0.01, lfc >1) at sub-family (LINE, SINE, and ERV) levels in non-treated WS- and gcWS-iMφs (left), for which levels of H3K9me3 were determined by ChIP-seq in non-treated WS- (n = 3) and gcWS-iMφs (n = 3) (right). Two Sample t test was performed to calculate the p values. Boxes represent the 25–75 percentile ranges with the median of the horizontal line and the mean of the plus. The ends of vertical lines represent the 10 or 90 percentiles. oxLDL oxidized low-density lipoprotein, CPM counts per million, C1-8; cluster 1-8, long-interspersed nuclear element (LINE), short-interspersed nuclear element (SINE), and endogenous retrovirus (ERV). In this figure, n represents biologically independent samples. Source data are provided as a Source Data file.

