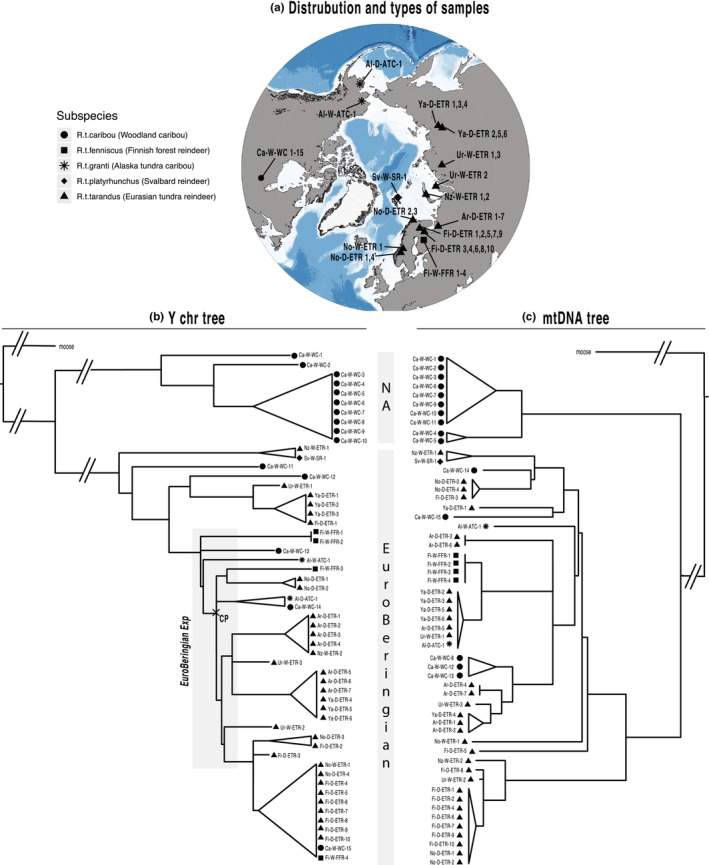
FIGURE 2.

Distribution and types of sampled individuals, Y‐chromosomal and mtDNA trees. (a) Geographic regions of sample collection were plotted with ggOceanMaps package in R (4.2.2.). Different shapes refer to subspecies. Sample names reflect sampling location – type of animal (wild/domestic) – subspecies. Sample details are given in Table S1. (b, c) Y‐chromosomal and mtDNA parsimony trees of 55 male Rangifer tarandus samples rooted with a moose. The two well‐separated clades (NA and EuroBeringian) are marked. Trees are collapsed for major haplogroups (uncollapsed versions are in Figure S3). The proposed EuroBeringian Expansion event in Y‐chromosomal tree, related to population growth after the LGM is shown in the gray area and the calibration point (CP) for dating is marked. Maximum likelihood (ML) trees with bootstrap values are given in Figure S4.
