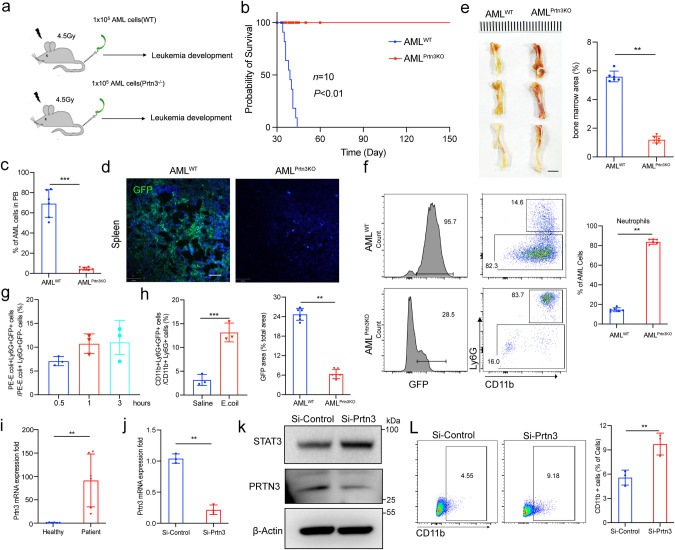
Fig. 7. PTRN3 deficiency restarts the maturation and differentiation of leukemic blast.
a The experimental design. b Survival curves of AML recipients with WT or Prtn3−/− AML cells (n = 10 per group). c histogram analysis of the percentage of GFP+ leukemia cells in the peripheral blood (PB) of recipients 30 days after transplantation (n = 6). d immunofluorescence staining assay shows GFP+ leukemia cells in the spleen of recipients 30 days after transplantation (n = 6). e The bone marrow color (left) and histogram (right) of recipient on 30 days after transplantation (n = 6). f Flow cytometry (left) and histogram (right) analysis show the percentages of neutrophils from AML cells (GFP+) in the BM of recipients (n = 6). g Histogram analysis shows the percentages of GFP+ neutrophils with PE-E.coli uptake from BM of AMLPrtn3KO recipients at different time points (n = 3). h Histogram analysis shows the percentages of GFP+ neutrophils capable of chemotaxis migration in the abdominal cavity of AMLPrtn3KO recipients with E. coli injection for 6 h (n = 3). i messenger RNA of Prtn3 expression in healthy peoples and patients (n = 6). j, k messenger RNA and protein expression of PRTN3 and β-Actin were analyzed in HL60 cells with Si-control or Si-Prtn3 treatment for 24 h (n = 3). l Flow cytometry (left) and histogram (right) analysis of the percentage of CD11b+ leukemia cells in the HL60 cells with Si-control or Si-Prtn3 treatment for 7 days (n = 3). *p < 0.05, **p < 0.01, ***p < 0.001. Data are the mean ± s.d.; n: biologically independent experiments. Statistical analysis was performed using an unpaired two-tailed Student’s t test.

