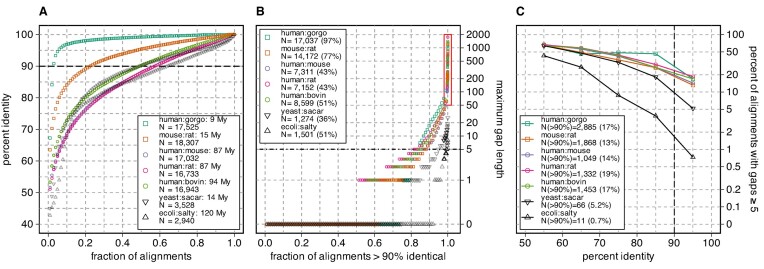
Figure 1.
Identity and gap lengths for pairs of mammalian, yeast, and bacterial proteomes. The complete canonical reference proteome of human (UniProt release 2022_05, 20 594 sequences) was compared to the canonical reference proteome of gorilla (21 783), mouse (21 968), rat (22 816), cow (23 844) and the canonical mouse proteome was compared to rat. In addition, the canonical E. coli proteome (4402) was compared to S. typhimurium (salty) (4533) and the canonical S. cerevisiae (yeast) proteome (6060) was compared to S. arboricola (sacar) (3653). Searches used the Smith–Waterman algorithm and the VT40 scoring matrix, as described in Materials and Methods. (A) The highest scoring statistically significant hits (E() < 10−6) from each query longer than 100 aa are ranked by percent identity; 100 samples from that ranking are plotted for each pair of proteomes. The legend shows the search pair (e.g. human:gorgo, human:gorilla), the evolutionary distance between the two proteomes, and the number of queries that produced a statistically significant hit. Alignment pairs above the dashed line at 90% identity were used in panel (B). (B) The alignments with >90% identity are ranked from shortest to longest maximum gap length and 100 samples, plus all alignments with a maximum gap length of >50, and the longest 25 gaps, are plotted. The panel (B) legend shows the total number (and percent) of alignments from panel (A) with >90% identity. The red rectangle highlights alignments with gaps ≥50 aa. (C) Percent of alignments with a gap ≥5 residues versus percent identity. The legend shows the number of alignments with a gap ≥5 residues for alignments that are >90% identical; this number corresponds to the points plotted at 95% identity in panel (C).

