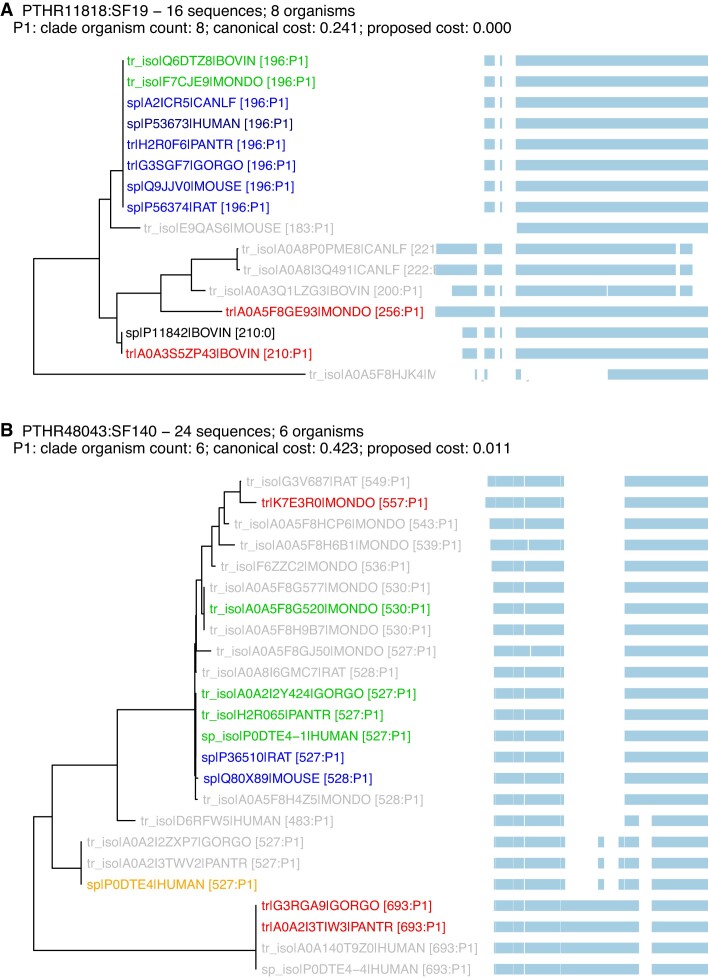
Figure 3.
Phenograms highlighting selected clades for two Panther orthogroups: (A) PTHR11818:SF19 (β-crystallin A4); (B) PTHR48043:SF140 (UDP-glucuronosyltransferase, E.C. 2.4.1.17). For each panel, a gap-distance based evolutionary tree and multiple sequence alignment are shown. Each panel also shows the total number of canonical and isoform sequences examined and the number of organisms with a sequence in this orthogroup, followed by a list of proposed replacement (P1) clades and their sizes and costs. In the tree, blue sequences are canonical accessions; the darker sp|P53673|HUMAN --> sequence in panel (A) was selected by the MANE (13) consortium. Accessions shown in red and orange are proposed to be changed; orange canonicals have been selected by MANE. For both red and orange, there is a corresponding green isoform that is proposed to be canonical. Black accessions indicate canonical isoforms that are not included in a low-cost clade. Gray accessions indicate non-canonical isoforms. Numbers after each protein accession indicate the length of the sequence, and its assigned clade (P1). This figure was drawn using the ggtree package for ’R’ (27).

