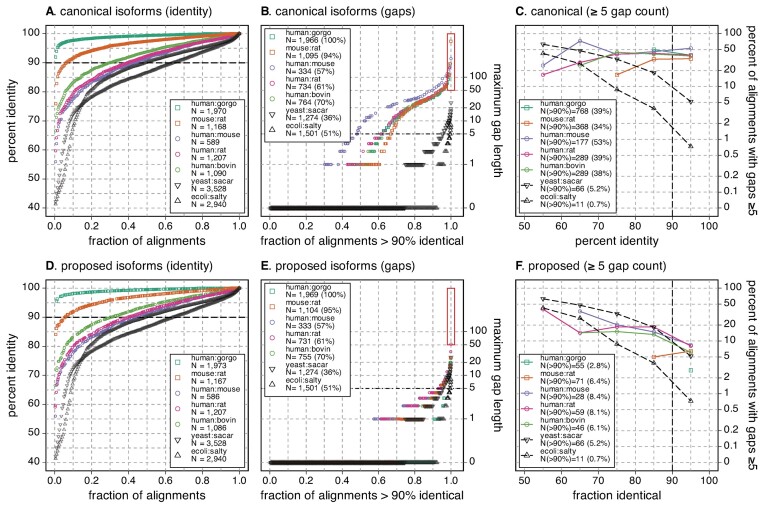
Figure 5.
Ortho2tree proposed changes reduce gaps in orthologs. (A) Percent identities for confirmed canonical isoform clades for the proteome pairs shown in Figures 1 and 4 and the E. coli versus S. typhimurium and S. cerevisieae versus S. arboricola comparisons. One hundred samples are shown for each proteome pair. (B) Distribution of the maximum gap sizes for the 100 samples shown in (A), plus alignments with gaps longer than 50 residues and the 25 longest gaps. (C) The percentage of alignments with gaps ≥5 residues versus alignment percent identity for all the pairwise alignments shown in (A). (D) Percent identity, (E) maximum gap lengths in >90% identical alignments, and (F) percent of alignments with gaps ≥5 residues for the proteins plotted in panels A–C, using the alternative isoforms proposed by ortho2tree. The distributions of ecoli:salty and yeast:sacar in panels A–C and D–F replot the data shown in Figure 1.

