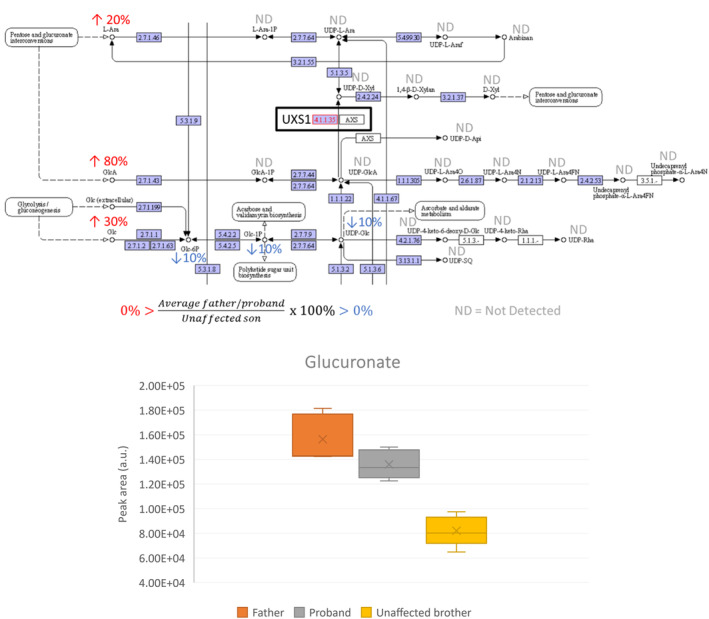
FIGURE 7.

Focused metabolomics of proteoglycan synthesis pathway. (a) Part of amino sugar and nucleotide sugar metabolism in KEGG database (Kanehisa Laboratories, n.d.). % Peak area of compound in samples from father and proband compared to unaffected brother. ND = not detected by the metabolomics method. (b) Glucuronate peak area in samples of father, proband and unaffected brother (N = 5). Father and proband had an ~80% higher level than the unaffected brother (90% and 70%, respectively).
